


INTRODUCTION
Nonalcoholic fatty liver disease (NAFLD) is a disease with severe inflammatory processes related to many gastrointestinal diseases, with a reported global prevalence of 25% to 30% [1]. Several factors are associated with NAFLD development, including obesity, diet, sedentary lifestyle, and hyperlipidemia. NAFLD diagnosis and treatment is challenging, considering that approximately 51% of patients with NAFLD are obese, 22% have type 2 diabetes mellitus (DM), 79% have hyperlipidemia, 39% have hypertension, and 42% experience some form of metabolic syndrome [1].
In contrast, inflammatory bowel disease (IBD) is a chronic, relapsing, and remitting intestinal disorder typically categorized into 2 subtypes as follows: ulcerative colitis (UC) and Crohn’s disease (CD) [2]. The highest prevalence of IBD is documented in Europe and North America. Additionally, IBD incidence has increased substantially since 1990 in newly industrialized countries across Africa, Asia, and South America, when they became more Westernized.3,4 In Taiwan, an increasing incidence of IBD (both UC and CD) and a decreasing UC-to-CD ratio, particularly among patients aged 20-39 years, has been reported from 2001 to 2015 [5]. However, both diseases are caused by severe inflammatory processes, with only a few studies reviewing the relationship between NAFLD and IBD [6].
More than 99% of Taiwan’s population (including foreigners) is enrolled in the single-payer National Health Insurance program, whose National Health Insurance Research Database (NHIRD) contains the registration files and the original claim data for reimbursement. However, the use of the NHIRD is limited to research purposes, and applicants must follow the related laws and regulations of Taiwan. Therefore, using the NHIRD, we investigated the association between NAFLD and IBD and the possible risk factors associated with NAFLD in patients with IBD.
METHODS
1. Data Source
This retrospective population-based cohort study contained fully anonymized medical records extracted from the NHIRD from January 1, 2000 to December 31, 2015. All patient demographics (including age, sex, urbanization, season, and related comorbidities) were recorded and analyzed.
2. Patient Selection
The International Classification of Disease, Ninth Revision, Clinical Modification (ICD-9-CM) was used to identify the study population diagnosed with IBD (ICD-9-CM codes 555 and 556). Patients aged ≥ 18 years who had received ICD-9-CM codes 555 and 556 once during hospitalization or at least three times during outpatient visits were included. In contrast, patients diagnosed with NAFLD (ICD-9-CM codes 571.5, 571.8, and 571.9) before January 1, 2000, or without complete tracking and unknown sex, were excluded. We also excluded patients diagnosed with IBD or IBD-related disease before NAFLD. Furthermore, we selected a group of patients without NAFLD during the study period as a comparison cohort using similar exclusion criteria. This control group was four times the number of patients in the IBD group and was matched to the patient’s sex, age, and inclusion date. Patients were followed up until IBD incidence was found in the records of outpatient or inpatient visits or until the end of the study period (December 31, 2015).
3. Comorbidities
We identified the following baseline comorbidities: DM, histo‑ ry of pancreatoduodenal resection, hypothyroidism, polycys‑ tic ovary syndrome (PCOS), hypogonadism, dyslipidemia, obesity (body mass index 30.0-40.0 kg/m2; morbidity obesity, body mass index > 40.0 kg/m2), and obstructive sleep apnea (OSA). Supplementary Table 1 lists the ICD-9-CM codes used for data extraction and analysis.
4. Statistical Analyses
SPSS software (version 22.0; SPSS Inc., Chicago, IL, USA) was used for all the analyses. We analyzed the characteristics of patients and compared them between the IBD and control (without IBD) groups, considering both baseline and endpoint for this cohort. Categorical and continuous variables were reported as numbers and percentages and mean ± standard deviation, respectively. Continuous variables in the 2 groups were compared using an independent Student t-test, whereas Pearson chi-square and Fisher exact tests were used to evaluate the differences in categorical variables. Hazard ratios (HRs) for the association between potential clinical variables, including sex, age group, season, urbanization, and related comorbidities, and IBD development were evaluated using univariate and multivariate Cox regression analyses. Furthermore, the cumulative risk of IBD development between the 2 cohorts was assessed using the Kaplan-Meier method and compared employing the log-rank test. Statistical significance was set at P< 0.05.
RESULTS
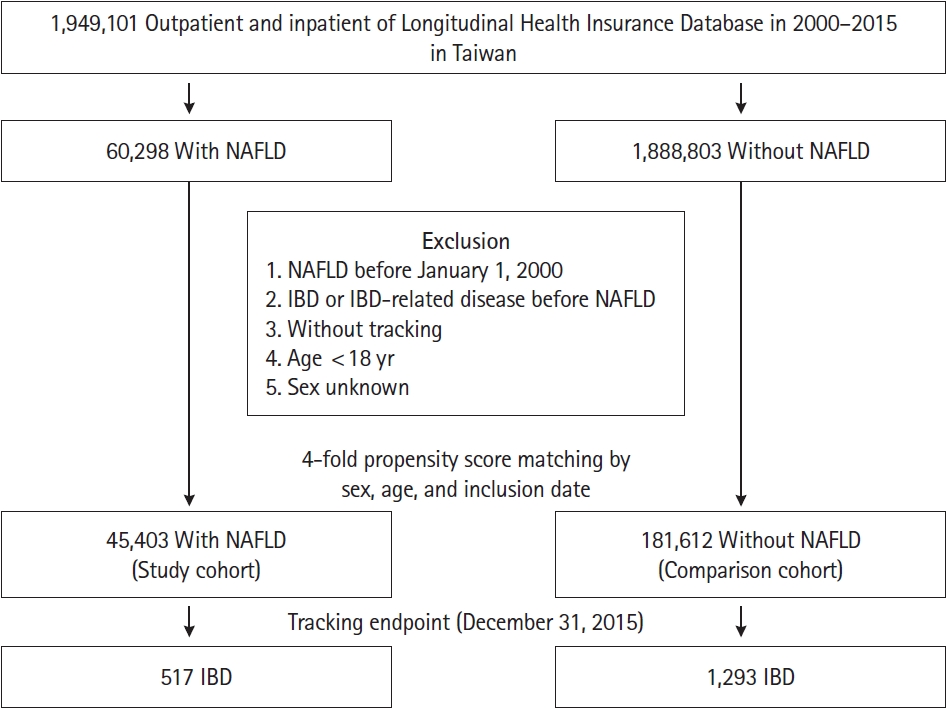
Fig. 1 shows the flowchart of the patient selection process used in this cohort. In total, 60,298 patients with NAFLD were identified from the NHIRD database comprising 1,949,101 individuals from 2000 to 2015 in Taiwan. A study cohort of 45,403 patients with NAFLD was selected for further analyses after excluding 14,895 patients. Subsequently, a 4-fold group of 181,612 individuals matched by sex, age, and index date was selected as the control cohort.
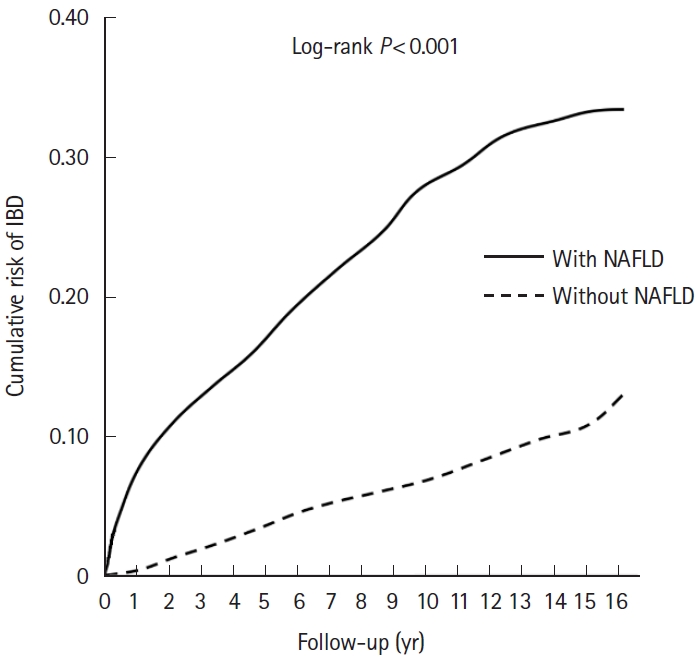
Table 1 presents the demographic characteristics of the enrolled patients at baseline. Overall, 227,015 individuals, including 45,403 patients with NAFLD and 181,612 without NAFLD, were enrolled in this study. The mean follow-up period in all patients and those with IBD was 8.80 ± 5.67 years and 6.82 ± 6.37 years, respectively (Supplementary Table 2). Among all age groups, most patients (26.02%) were aged 30-39 years. The mean age of patients with and without NAFLD was 41.26 ± 15.10 and 41.39 ± 15.21 years, respectively. Regarding the associated comorbidities, post-pancreaticoduodenal resection, hypothyroidism, DM, PCOS, dyslipidemia, obesity, and OSA were found to be significantly more prevalent (all P< 0.001) in patients with NAFLD than in those without NAFLD. Table 2 presents the characteristics of the clinical endpoints. Significant differences in age, season, location, urbanization level, care level, and multiple comorbidities (all P< 0.001) were found between patients with and without NAFLD. Fig. 2 shows the KaplanMeier curve for the cumulative risks of developing IBD stratified by NAFLD using the log-rank test. The cumulative risk of IBD development was significantly higher in patients without NAFLD than in those with NAFLD (P< 0.001 log-rank test).
Table 3 shows the adjusted HR (aHR) of IBD stratified by the variables listed in the table using Cox regression. Patients with coexisting NAFLD had a 2.245-fold increased risk of IBD compared with those without NAFLD. Significant differences (P< 0.001) existed in all confounding factors, including male sex (aHR, 2.312), age (aHR, 2.029-2.379), season (aHR, 2.132-2.404), urbanization level (aHR, 2.165-2.295), and comorbidities, such as post-pancreaticoduodenal resection, DM, PCOS, dyslipidemia, obesity, and OSA. Regarding the IBD subgroup, patients with coexisting NAFLD had a 2.260- and 2.231-fold increased risk of UC and CD, respectively, compared with those without NAFLD (Table 4). For the NAFLD grade, patients with NAFLD and liver cirrhosis (aHR, 2.349) had a statistically higher risk of developing IBD than those without liver cirrhosis (aHR, 2.191) (Table 5). In cases where patients may be underdiagnosed with NAFLD or IBD, a sensitivity test was conducted to exclude those diagnosed with both NAFLD and IBD within 6 months, and patients with NAFLD should be associated with the diagnosis of IBD (Supplementary Table 3).
DISCUSSION
Although only a few small-scale studies have reviewed the association between IBD and NAFLD, our study is one of the first large retrospective studies, including 16-year longitudinal analyses, that employed data obtained from the Taiwan NHIRD to investigate the relationship between NAFLD and IBD. Our results showed that patients with NAFLD should be associated with the diagnosis of IBD compared with those without NAFLD. Additionally, the presence of pancreaticoduodenal resection, DM, PCOS, dyslipidemia, obesity, hypogonadism, OSA, higher urbanization level, and winter season were risk factors for IBD development.
NAFLD is a disease characterized by excess fat accumulation in a patient’s liver without a history of alcohol abuse or other causes of secondary hepatic steatosis; it is associated with severe inflammatory processes linked to several gastroenterological diseases, with a reported prevalence of 25% worldwide [1,7]. NAFLD demonstrates a spectrum of steatohepatitis, steatonecrosis, and nonalcoholic steatohepatitis (NASH) [8,9]. Specifically, steatonecrosis and NASH have been reported to possibly lead to an aggressive course, which consequently causes liver fibrosis or cirrhosis [10]. Leptin and adiponectin play important roles in NAFLD etiology since leptin is believed to act as a pro-inflammatory factor that increases hepatotoxicity by regulating cytokine production and T-cell activation [11]. Additionally, leptin augments the oxidation of fatty acids in the liver by activating peroxisome proliferator-activated receptor-alpha and increasing NAFLD severity [12]. In contrast, adiponectin enhances glucose and fatty acid oxidation, improves insulin sensitivity, and plays a role in the hepatoprotective effects of adiponectin, including antisteatotic, anti-inflammatory, and antifibrogenic effects [13]. However, adiponectin levels are reduced in patients with NAFLD, causing steatosis, necroinflammation, and fibrosis [14].
Lipotoxicity of accumulated lipids and activation of the innate immune system, including C-reactive protein, interleukin-6, tumor necrosis factor-alpha, and osteopontin, amplify the induction of NASH [15,16]. Persistent liver lipid deposition is associated with subsequent inflammatory processes and consequences, and this inflammatory process causes NAFLD and is associated with other systemic diseases [17].
Although potential factors include genetic predisposition, environmental conditions, and immunological dysfunctions, the exact etiopathogenesis of IBD remains unknown [18]. A decrease in the mRNA levels of leptin and adiponectin in the mesenteric adipose tissue and an increase in the inflammatory factors have been reported in patients with IBD [19]. Al-Hassi et al. [20] also demonstrated that leptin causes mesenteric obesity and inflammation in CD. However, adiponectin has been reported to maintain intestinal homeostasis, protect against murine colitis, and alleviate murine colonic injury [21].
Fousekis et al. [22] reported an association between IBD and NAFLD, revealing that 14.2% of the patients with CD and 26.2% of those with UC had NAFLD. Wald [23] demonstrated a statistically higher prevalence of NAFLD in patients with IBD. Our study similarly showed a statistically significant increase in the risk of NAFLD in patients with IBD. Although some reports have shown an association with the adipokine profile, this link between IBD and NAFLD remains unclear [17]. In addition to leptin and adiponectin, apelin has been suggested to play a key role in NAFLD by promoting liver fibrosis [24,25]. Furthermore, a recently published meta-analysis, including 1 and 18 studies from Japan and Western countries, respectively, found an overall prevalence of NAFLD in 27.5% of patients with IBD and identified type 2 DM, obesity, insulin resistance, and metabolic syndrome as risk factors for its development [26]. Hoffmann et al. [27] reported that advanced age was related to a higher risk of NAFLD in patients with CD, whereas the highest risk of NAFLD in our study was reported in those with IBD aged 50-59 years.
Our study demonstrates that some risk factors in patients with NAFLD that may develop IBD were identified using multivariate Cox regression, including winter season, higher urbanization level, history of pancreatoduodenectomy, presence of DM, dyslipidemia, hypogonadism, obesity, and OSA. Additionally, Principi et al. [28] reported that DM and metabolic syndrome are risk factors for developing NAFLD-associated IBD. A meta-analysis showed an increased risk of new-onset DM in patients who underwent pancreatoduodenectomy [29], and we believe this may be why those with NAFLD undergoing pancreatoduodenectomy have an increased risk of developing IBD. Our report showed that hypogonadism is associated with a more than 3-fold increased risk of developing IBD. In fact, Szathmári reported that 40% of male patients with IBD had coexisting hypogonadism [30]. Whereas Gesthimani Mintziori demonstrated that sex steroid played an important role in hepatic lipid homeostasis and may have protective effect to liver. And high NAFLD risk in hypogonadism patients regardless of men and women [31]. McGowan et al. [32] previously reported the improvement of therapies and nutritional status as the cause of obesity among the IBD population, with a direct relationship between prolonged remission and a higher risk of NAFLD development. Moreover, Greuter et al. [33] reported differences in the gender epidemiology of CD, noting a male predominance in Asia and a female predominance in Europe and the United States. Regarding the relationship between urbanization, season, and IBD, Soon et al. [34] showed that urbanization is a major risk factor for IBD development. Koido et al. [35] also reported that winter and spring may increase the risk of developing UC. According to the results of our large cohort study and previous studies, the abovementioned risk factors may be pertinent for patients with NAFLD and IBD. Although the second peak age of IBD reportedly occurred in 50- to 70-year-old patients, the exact reason remains controversial [36]. Our study showed that 50- to 59-year-old patients had a statistically higher risk of developing IBD. Therefore, the abovementioned risk factors or NAFLD may be related to the second peak of IBD.
This study has several strengths. First, this was a nationwide population-based cohort study using a million-level database in Taiwan. Given its large sample size and long-term follow-up period, the study provided relatively good statistical power for this rare disease in patients with IBD. Second, a 4-fold control group matched by sex, age, and index date was selected for comparison. Possible confounding factors were also adjusted during the multivariate Cox regression analysis. Nevertheless, this study had some limitations. First, almost all study participants were Taiwanese, resulting in poor generalizability and broader application of the study results for patients from other racial or ethnic groups. Second, the medications prescribed (either for IBD or other comorbidity diseases, e.g., DM) were not stratified in this study; consequently, the influence of medication treatment could not be ruled out. Third, by NHIRD, we could only record the ICD code of NAFLD and the records lack of pathological confirmation. Meanwhile, NAFLD prevalence may be underdiagnosed for patients who do not seek medical attention or lack NAFLD diagnosis coding. Fourth, we could only classify patients with NAFLD with or without liver cirrhosis, and no ICD code exists for the NAFLD subgroups, such as NASH. Consequently, we lacked analysis of the NAFLD subgroups developing IBD. No ultimate treatment for IBD exists, and treatment-related side effects should be considered individually. However, no reported correlation with NAFLD among the current treatments for IBD exists. Therefore, either treatment-related complications or the possible protective effects of IBD drugs on NAFLD development require further investigation. Finally, this study found a significantly higher risk of developing NAFLD in patients with IBD after adjusting for confounding factors. However, the exact interaction between NAFLD and IBD remains unclear. This may be multifactorial and requires further investigation.
In conclusion, patients in this cohort with NAFLD may have an increased risk of subsequent IBD development. Specifically, patients with NAFLD and liver cirrhosis may have a higher risk of developing IBD. The risk of IBD development in patients with NAFLD with some comorbidities, such as DM and dyslipidemia, was also significantly higher than that for those without these risk factors. When patients with NAFLD present with the abovementioned risk factors, they should be carefully treated and regularly followed. Furthermore, these risk factors may be related to the “second peak of IBD.”