


INTRODUCTION
Nonalcoholic fatty liver disease (NAFLD) is a leading cause of chronic liver disease, which can progress to cirrhosis, liver cancer, or liver failure [1]. NAFLD is commonly linked with obesity associated with lifestyle-related diseases [2,3]. The estimated prevalence of NAFLD is increasing worldwide, including in Japan [4,5]. Therefore, identification of risk factors, early diagnosis, and intervention are crucial in the management of this common disease. NAFLD is also a comorbid condition in nonobese patients [6]. The prevalence of NAFLD in nonobese patients is high, especially in Asia, where it has been reported to be 7%-20% [7-9].
Inflammatory bowel disease (IBD) is a chronic inflammatory disease that includes Crohn’s disease (CD) and ulcerative colitis (UC) [10]. Some patients with IBD are prone to malnutrition, which is associated with adverse outcomes and requires nutritional support [11-13]. The reported frequency of malnutrition in patients with active IBD ranges from 25.0% to 69.7% [14], and protein-energy malnutrition is particularly common [15]. Elevated transaminase levels are also common in patients with IBD [16], and NAFLD is the most common cause of these elevations [17].
In recent years, many cases of comorbid NAFLD have been reported in patients with IBD [18-22]. Although patients with IBD complicated with NAFLD have been reported to have better treatment outcomes [23], the significance of these better treatment outcomes remains unclear. Moreover, most of the relevant reports have been based on findings on abdominal ultrasound, and there are no reports based on computed tomography (CT) imaging.
A severe life-threatening condition called intestinal failureassociated liver disease (IFALD) is known to be caused by NAFLD and/or cholestasis in patients with long-standing malnutrition.24 Therefore, early accurate diagnosis of NAFLD using CT or other methods is important for prevention of IFALD. Having knowledge of the clinical characteristics of NAFLD and its risk factors in patients with IBD is important to make a correct diagnosis and allow early therapeutic intervention. Therefore, in this study, we aimed to determine the clinical characteristics of Japanese patients with a diagnosis of IBD and comorbid NAFLD diagnosed by CT imaging.
METHODS
1. Patients
This study had a retrospective single-center design and included patients diagnosed with UC or CD in accordance with the standard criteria outlined in the Japanese UC and CD guidelines at Fukuoka University Hospital (Fukuoka, Japan) between January 2005 and October 2020. Patients younger than 15 years and those who had not undergone CT were excluded. In all patients, the presence or absence of fatty liver was diagnosed by CT. During the study period, CT examinations were performed using Aquilion ONE 16-row (2005-2018), 64-row (2006-2020), 80-row (2018-2020), and 320-row (2014-2020) systems and, from 2015 onwards, the Aquilion GE Revolution 64-row system (Canon Medical Systems, Inc., Tochigi, Japan). The hepatosplenic ratio was determined by measuring the average CT values for the left and right liver lobes and 2 areas of ≥ 2 cm2 in the spleen. A hepatosplenic ratio of < 1.12 supports a diagnosis of fatty liver [25]. Among patients with fatty liver diagnosed using the above methods, those in whom there was no other obvious cause, such as viral hepatitis or excessive alcohol intake ( > 30 g/day for men, > 20 g/day for women), were diagnosed as having NAFLD (study 1) [26]. A recent report suggested that characteristic NAFLD associated with IBD is more likely to be underweight and less prone to lifestyle-related diseases [27]. Therefore, we excluded the patients with body mass index (BMI) of ≥ 25 kg/m2, which corresponds to obesity in Japan [28], from subsequent analyses (study 2) to eliminate NAFLD due to lifestyle-related diseases. Muscle mass was measured at the level of the third lumbar vertebra (L3) and the iliopsoas muscle using Core Slicer (a free and open-source web-based interface that facilitates the measurement of analytic morphomics by clinicians) [29,30]. A muscle mass at the L3 level of < 42 cm2/m2 in men and < 38 cm2/m2 in women and/or a psoas muscle index of < 6.36 cm2/m2 in men and < 3.92 cm2/m2 in women supported a diagnosis of sarcopenia [31].
2. Endpoints
The primary endpoint of this study was to evaluate the complication rate of NAFLD in IBD patients who underwent CT for some reason. The secondary endpoints were as follows: (1) a comparison of patient background factors and blood biochemistry findings between those with NAFLD and those without NAFLD; (2) the relationship between the hepatosplenic ratio and the prognostic nutritional index (PNI) and C-reactive protein (CRP) level; (3) changes in blood biochemistry findings between 1 year before CT imaging and the time of CT imaging; (4) changes in blood biochemistry findings between the time of CT imaging and 1 year later; and (5) changes in use of steroids and biologic agents after CT imaging.
3. Clinical Parameters
The PNI is an indicator of nutritional status that uses the serum albumin level and the total lymphocyte count (PNI = 10 × albmin [g/dL]+0.005 ×total lymphocyte count [/μL]). It is generally used as a prognostic tool and for postoperative evaluation [32]. Patients without malnutrition have a PNI of 50-60, and those with a PNI < 40 are considered to be undernourished. Although this definition of PNI is simple, it is widely used for nutritional assessment in various disease areas [33,34].
4. Statistical Analysis
Continuous data are presented as the median (range), and categorical data as the number (percentage) within groups. A nonparametric Wilcoxon test was used to compare numerical values between groups. Multivariate analysis of variance (MANOVA) was used to analyze repeated measures over time for individuals. All statistical analyses were performed using JMP 14.2.0 (SAS Institute Inc., Cary, NC, USA). A P-value of < 0.05 was considered to be statistically significant.
5. Ethical Approval and Consent to Participate
This retrospective study was conducted in accordance with the relevant guidelines and declarations, including a formal waiver of informed consent, and was approved by the Fukuoka University School of Medicine, Division of Bioethics in Medical Research (U21-01-008). For confidentiality and ethical considerations, the retrospective data used encrypted identification of individuals, and individual identification numbers were converted using random number strings.
RESULTS
1. Complication Rate of NAFLD in Patients with IBD and the Number of NAFLD by BMI
A total of 426 patients were diagnosed with IBD at our hospital during the study period. After exclusion of 330 patients for whom CT scans were not performed or the age was younger than 15 years, 96 patients were studied first (study 1) (Fig. 1). The primary endpoint, the complication rate of NAFLD in patients with IBD, was examined. Twenty-one (21.9%) of 96 patients with IBD also had NAFLD. When IBD patients were charted by a BMI, in addition to a normal distribution centered on BMI of 19 kg/m2, there were some patients with a BMI of 30 kg/m2, and when NAFLD patients were similarly examined, a somewhat irregular but normal distribution centered on BMI of 17 kg/m2 was observed, but apart from this, NAFLD patients with high BMI values as in IBD were also observed (Fig. 2). There was no predominant difference in BMI between IBD patients with and without NAFLD (P= 0.684).
2. Complication Rate of NAFLD in Patients with IBD and a BMI of <25 kg/m2
After the exclusion of a further 10 patients with a BMI of ≥ 25 kg/m2, 86 patients were included in study 2. Eighteen (20.9%) of the 86 IBD patients with a BMI of < 25 kg/m2 had NAFLD. The prevalence of NAFLD was 33.3% in patients in the low weight range and 16.1% in patients in the healthy weight range (Table 1).
3. Patient Background Factors and Blood Biochemistry Findings According to NAFLD Status
Disease location and smoking history were significantly different between patients with NAFLD and those without NAFLD. In addition, only one patient had a stoma. A bivariate analysis of blood biochemistry findings showed that the platelet count (P=0.018) and CRP (P< 0.001), alanine aminotransferase (ALT; P= 0.018), and γ-glutamyl transpeptidase (P= 0.034) levels were significantly higher in patients with NAFLD complications than in those without NAFLD. Albumin (P= 0.005), total cholesterol (P= 0.010), and PNI (P= 0.002) values were significantly lower in patients with NAFLD complications than in those without NAFLD. There was no significant difference in the clinical data between these patient groups based on whether or not they had sarcopenia (Table 2).
4. Relationship between the Hepatosplenic Ratio and the PNI and CRP Level
Bivariate analysis of the PNI value and CRP level was performed at the timing of CT imaging. Although there was a weak correlation between these 2 parameters and the hepatosplenic ratio on CT images (R2 = 0.163 and R2 = 0.128, respectively), the lower hepatosplenic ratio was associated with significantly lower PNI and significantly higher CRP levels (Fig. 3).
5. Changes in Blood Biochemistry Findings in 1 Year before and after CT Imaging
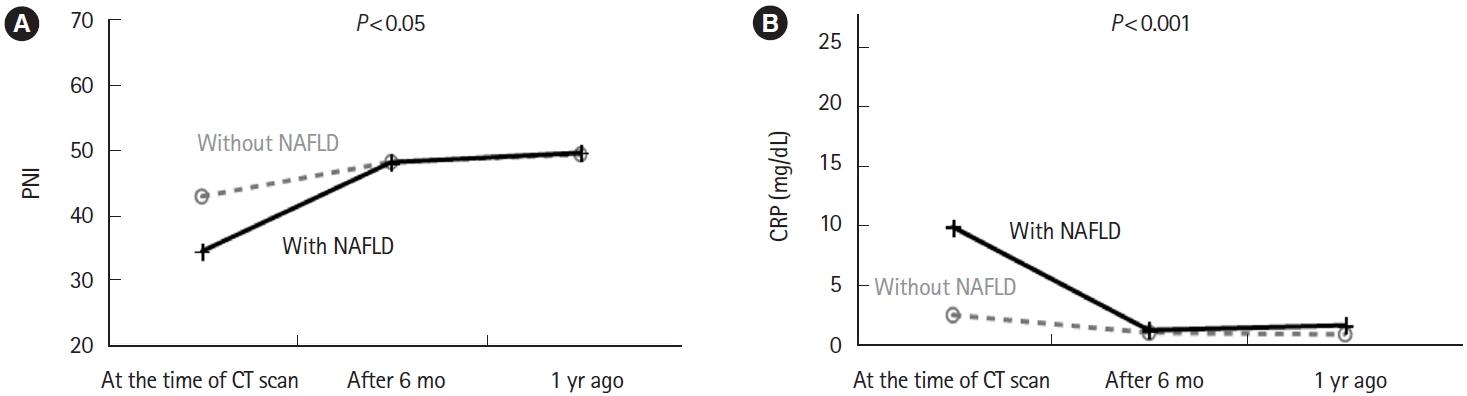
When the MANOVA test was performed on blood biochemistry findings at the time of CT imaging and at 6 months and 1 year before CT imaging, the PNI value was significantly lower in the group with NAFLD complications than in the group without NAFLD (P< 0.05). Although, this test showed a tendency for a high CRP level to be maintained in the group with NAFLD complications up until the diagnosis was made on CT, the between-group difference was not statistically significant (Fig. 4). The MANOVA test on the blood biochemistry findings at the time of CT imaging and after 6 months and 1 year revealed that the PNI value (P< 0.05) and CRP level (P< 0.001) were significantly improved in the group with NAFLD than those without NAFLD (Fig. 5).
6. Changes in Use of Steroids and Biologic Agents after CT Imaging
There was no significant difference in the frequency of increasing the dose or switching from a steroid to a biologic agent after CT imaging between the group with NAFLD complications and the group without NAFLD (Table 3).
DISCUSSION
There are few studies of IBD patients who have been diagnosed with NAFLD based on CT scan, and this is the first study to investigate that in the Asian region. Although liver biopsy is certainly the gold standard for the diagnosis of fatty liver, it is extremely invasive to perform in IBD patients, and in this regard, CT scans may be performed in some IBD patients for the purpose of understanding the pathophysiology. Unlike ultrasonography, which assesses liver-kidney contrast, fatty liver diagnosed by CT imaging uses the hepatosplenic ratio and allows for more objective assessment [35,36]. Therefore, our present study was able to evaluate NAFLD status more accurately than was possible in previous studies. We first analyzed the complication rate of NAFLD in all patients with IBD (study 1). We found that 21 (21.9%) of 96 patients with IBD. In the present study, these patients were observed not only in the nonobese group but also in the obese group. This suggests that the mechanism of NAFLD development in IBD patients is not only due to low body weight [33], but also includes NAFLD associated with common lifestyle-related diseases [17,37]. However, IBD patients are generally considered to have poor nutritional status and it has been noted that IBD patients with NAFLD have fewer metabolic risk factors [33], and weight loss and malnutrition may promote fat deposition in the liver [15]. Therefore, in order to reduce metabolic risk factors, we limited our evaluation to patients with BMI < 25 kg/m2 (study 2). As the result, the patients with IBD and a BMI of < 25 kg/m2 showed almost the same complication rate of NAFLD (18/86, 20.9%) compared to study 1 population. This result is comparable to the previously reported prevalence of fatty liver disease in IBD patients [38] and indicates that nonobese patients may develop NAFLD as well as obese patients. Furthermore, the complication rate of NAFLD in the group that was underweight tended to be higher (8/24, 33.3%) than that in the group with weight in the healthy range (10/62, 16.1%). These results indicate that NAFLD complications are more common in IBD patients with poor nutritional status and also suggest that there may be a difference in the mechanisms involved in development of NAFLD between that induced by lifestyle factors such as obesity and that associated with IBD with a BMI of < 25 kg/m2. Furthermore, it is noteworthy that among the 8 patients who reported alcohol consumption, only a single individual exhibited signs of fatty liver. It is worth acknowledging that, typically, individuals who consume alcohol tend to have a higher prevalence of fatty liver compared to non-drinkers [39]. However, it is important to consider the limitations of this study, such as its focus on individuals with a BMI below 25 kg/m2, and the possibility that the subset of IBD patients who consumed alcohol may have had milder disease manifestations and lower levels of inflammation. Surprisingly, among the 24 patients who reported smoking, only one had NAFLD. Although the exact reason for this observation remains unclear in this study, previous research has suggested that smoking may confer a protective effect against disease onset in patients with UC [40]. Smoking deters the development and progression of UC via activation of aryl hydrocarbon receptor [41]. Although further study is needed to clarify this assumption, this fact might be related to our results.
In the present study, IBD patients complicated with NAFLD had a wide disease location and persistent malnutrition and inflammation from 1 year before CT imaging. Based on this observation, we put forth the hypothesis that the occurrence of NAFLD complications in IBD patients was primarily triggered by the malnutrition and inflammation associated with IBD. Supporting this hypothesis, by continuing the treatment for IBD, improvement of nutritional status and inflammation were observed 1 year after CT imaging. Therefore, the persistent malnutrition and inflammation status in IBD patients with NAFLD may be ameliorated by continued treatment of IBD, which may also improve NAFLD [42,43]. In particular, patients with the total colitis type in UC and ileo-colitis type in CD are at high risk for NAFLD, and attention should be paid to their nutritional status to prevent progression to NAFLD. NAFLD progresses to nonalcoholic steatohepatitis, leading to cirrhosis or liver cancer [1,6]. Recent relevant study had shown a risk of progression from metabolic-related fatty liver disease to liver fibrosis in patients with IBD [44]. Moreover, progression of NAFLD is an important factor in the development of IFALD, which is a life-threatening complication in patients with longterm malnutrition caused by chronic intestinal failure. Early detection of liver disease is important because it is often asymptomatic until development of late-stage complications [45]. Although our study also found an increase in the ALT level overall, over 85% of all cases were within the normal range, making it difficult to evaluate potential chronic liver disease or the early phase of NAFLD using ALT in clinical practice. Therefore, early diagnosis of NAFLD in patients with IBD by CT examination may improve the poor prognosis of IBD patients such as IFALD. Furthermore, our study revealed a correlation between the PNI and the hepatosplenic ratio. This finding suggests that PNI could potentially serve as a valuable tool for the early detection of NAFLD in patients with IBD. However, it is important to note that further investigations are necessary to validate and expand upon these preliminary findings. Additional studies are warranted to provide a more comprehensive understanding of the relationship between PNI and NAFLD in IBD patients, and to explore the potential utility of PNI as a diagnostic marker.
Some reports indicate that a low skeletal muscle mass index is associated with a risk of NAFLD in both men and women independent of other well-known risk factors of metabolic syndrome [46,47]. In this study in which the iliopsoas muscle mass was measured at the L3 level on CT images identified sarcopenia in 61.1% of patients with IBD and a BMI of ≤ 25 kg/m2. This finding suggests that patients with IBD may have latent nutritional disorders that induce sarcopenia. Therefore, patients with IBD should be evaluated for current nutritional status and treated appropriately. In the present study, there was no significant difference in the frequency of sarcopenia between patients with IBD complicated with NAFLD and those without NAFLD, which we attribute to the high incidence of sarcopenia and the small number of cases.
This study had at least 3 limitations. First, it had a retrospective single-center design and included a limited sample size. Therefore, we were unable to capture some important data and information, such as weight trends, CT imaging trends, and severity of IBD. Additionally, it should be noted that we were only able to determine the precise onset date in month for a few cases. The information on the onset date in years was used to evaluate the duration of the condition. However, no significant difference was found in the duration of IBD based on the presence or absence of NAFLD (P= 0.289). Nevertheless, due to the inherent imprecision associated with the broad 12-month timeframe, this paper does not present these findings as conclusive results but rather acknowledges them as limitations. Furthermore, the study was conducted at a tertiary care referral center and only included patients in whom CT was performed, which means that we cannot exclude the possibility that the underlying disease activity in our patients may be different from that in patients managed at a less specialized facility. However, to date, no other Asia study has used CT imaging to diagnose fatty liver. This diagnostic method is more objective and useful than evaluating the contrast between the liver and kidney on abdominal ultrasonography. Second, treatment for IBD is now being advanced continuously, and methods of therapeutic intervention differed depending at the time of imaging in this study. Therefore, we could not examine the complication rate of NAFLD in patients with IBD on the basis of the type of treatment.
Finally, our findings are based on 1 year either side of CT imaging, and whether they would change during longer-term follow-up is unknown. Additional studies are warranted in the future.
In conclusion, long-term malnutrition and inflammation status in nonobese patients with IBD are associated with the complication of NAFLD. Diagnosis of NAFLD in patients with IBD using CT imaging might be useful not only for early detection of NAFLD but also for assessing the need for therapeutic intervention for IBD.