


INTRODUCTION
Crohn’s disease (CD) is an inflammatory bowel disease that causes chronic inflammation in the digestive tract, particularly in the ileum and colon [1]. Progressive inflammation of the gastrointestinal tract leads to stenosis, fistula, and perforation, and approximately half of the patients require surgery within 10 years after diagnosis [2]. Therefore, proper evaluation of the patient’s prognosis is essential. Currently, there are several methods for evaluating CD activity. Balloon-assisted endoscopy enables the accurate assessment of small bowel lesions [3]. Mucosal healing on endoscopy can reduce the hospitalization rate and risk of surgery [4,5]. However, balloon-assisted endoscopy has certain disadvantages, such as the need for oral laxatives and sedation due to examination distress and the risk of complications [6]. Therefore, a less invasive examination is needed for patients with CD.
Computed tomography, magnetic resonance enterography, and transabdominal ultrasonography (US) have recently been reported to be useful for patients with CD [7]. However, computed tomography and magnetic resonance enterography have several limitations for frequent use in routine practice [8-11]. In contrast, US is noninvasive, inexpensive, widely available, and repeatable without radiation exposure. Endoscopy only evaluates the mucosal surface, whereas US evaluates the entire bowel wall thickness (BWT) and blood flow signals within the bowel wall using color Doppler [12-15] which reportedly helps evaluate CD activity.
Goodsall et al. [16] showed that BWT is a basic US finding, whereas the severity and acuity of inflammation are estimated by additional findings such as loss of stratification and increased mesenteric fat tissue echogenicity. Moreover, in CD, transmural healing (TH) is associated with improved long-term outcomes and might be a more suitable target than mucosal healing [17-20].
Patients with CD may have disease activity even when in clinical remission and may subsequently experience clinical relapse, hospitalization, or surgery [21,22]. Therefore, regular evaluation of disease activity is essential. Vaughan et al. [23] showed that patients with CD who were in clinical remission and had TH in US were less likely to experience adverse outcomes, such as enhanced treatment, hospitalization, corticosteroid use, and surgery. This suggests the potential usefulness of TH in predicting clinical remission. However, few studies have scored and assessed severity with US in non-US-TH cases and predicted the prognosis for several US findings.
Yamanashi et al. [24] previously developed a US scoring system using multiple US findings, defined as US-CD, and reported its usefulness. Using the US-CD, we scored patients with CD in clinical remission and evaluated the prognostic value of adverse outcomes. In this study, we aimed to examine the usefulness of US, which can be performed repeatedly in routine medical care, the ability of US-CD to predict adverse outcomes such as clinical relapse and the need for endoscopic balloon dilation (EBD) in clinical remission in patients with CD.
METHODS
1. Study Protocol
We conducted a single-center, retrospective, observational study at Hokkaido University Hospital. The study included patients with CD in clinical remission who underwent their first US between April 2011 and April 2021, focusing on the predictability of subsequent adverse outcomes within 5 years.
3. Ultrasonography
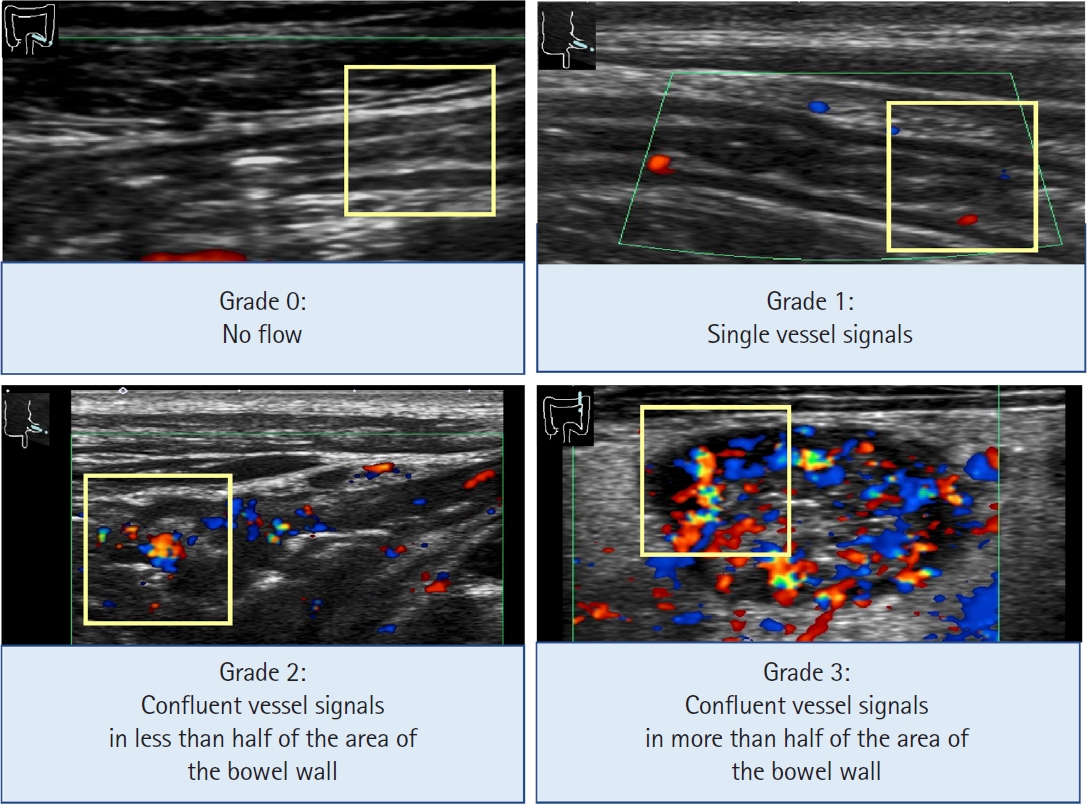
US was performed after fasting for a minimum of 12 hours. Several devices (Aplio XG, 500, and i800; Canon Medical Systems Corp., Otawara, Japan) were used to perform US. For the conventional ultrasound, probe center frequency: 3.8 MHz (range, 4.0-6.0 MHz) convex, 6.0 MHz (range, 4.0-9.5 MHz) convex, and 7.5 MHz (range, 6.0-9.0 MHz) linear probes were used. After scanning the colon, the end of the ileum was identified at the ileocecal valve, and the ileum was followed up as far as possible in the oral direction [27]. The bowel was divided into 4 sections (ileum, right lateral colon, transverse colon, and left lateral colon), and images of each section were captured. The rectum was excluded from the analysis due to its location in the deeper part of the pelvic cavity, making it challenging to evaluate using US [24]. We used US-CD to assess disease activity, which was calculated by summing the following US findings: BWT (0-3), loss of stratification (0-2), degree of blood flow signaling by color Doppler signal (0-3) (Fig. 1), mesenteric fat tissue echogenicity (0-2), and presence of stenosis (0-3) (Table 1) [24]. Scores were calculated for each bowel section, combined and scored out of a total 0-52 points. All still images and movie clips were scored by US-CD in a consensus manner by 2 registered sonographers at our hospital with 33 and 11 years of US experience, respectively. They were aware of the diagnosis but blinded to the patient’s clinical information.
4. Outcome
We examined the ability of US-CD to predict negative outcomes in patients with CD. Adverse outcomes were considered a clinical relapse, the need for EBD, enhanced treatment, or surgery. Clinical activity was assessed using the previously validated Crohn’s Disease Activity Index (CDAI) (Supplementary Table 1) [28]. Clinical remission was defined as CDAI < 150, and clinical relapse was described as an increase to CDAI ≥ 150 [28]. Enhanced treatment was defined as need for change in medication maintenance; including change or dose escalation of bio-logics and addition of 5-aminosalicylic acid, corticosteroids or immunomodulators. Surgery was defined as performed due to CD, however, anal surgery was excluded.
5. Statistical Analysis
P< 0.05 was considered statistically significant. P-values were calculated using the chi-square test for categorical data and the Mann-Whitney U test for continuous variables. P-values for Kaplan-Meier analysis were calculated using the log-rank test. Receiver operating characteristic (ROC) curves were constructed, and the trapezoidal rule was used to calculate the area under the ROC curve (AUROC). The optimal cutoff value of the US-CD for predicting adverse outcomes was identified based on the highest Youden index. Sensitivity, specificity, positive predictive values (PPVs), and negative predictive values (NPVs) were calculated using cutoff values from the ROC curves. Predictive variables were assessed using univariate and multivariate Cox proportional hazards regression analyses. Multivariate analysis was performed on variables with P< 0.05 in univariate analysis, which were expected to contribute to the objective variables from previous reports. The JMP Pro 16 software (SAS Institute Inc., Cary, NC, USA) was used for all statistical analysis.
6. Ethical Considerations
This study was approved by the Human Research Ethics Committee of Hokkaido University Hospital (IRB No. 022-0241). The study protocol was posted on the website. Patients opted out of the study if they did not wish to provide consent, and the requirement for informed consent was waived due to the retrospective nature of the study.
RESULTS
1. Patients’ Characteristics
Between April 2011 and April 2021, 178 patients with CD underwent US. Of these, 96 patients whose CDAI ≥ 150, 7 patients with insufficient clinical data, and 2 patients with an observation period of < 30 days were excluded. The remaining 73 patients (56 male, 17 female) were included in the analyses. The median age at diagnosis was 23 years (range, 13-68 years), 22 patients had the ileal type, 47 patients had the ileocolonic type, and 4 patients had the colonic type of CD. The median observation period was 1,441 days (range, 41-1,825 days). The median CDAI at baseline was 71 (range, 14-143) (Table 2). The median US-CD score was 9 (range, 0-42). The median score for the ileum was 6 (range, 0-12), right lateral colon was 0 (range, 0-11), transverse colon was 0 (range, 0-11), and left lateral colon was 1 (range, 0-13).
2. Clinical Relapse
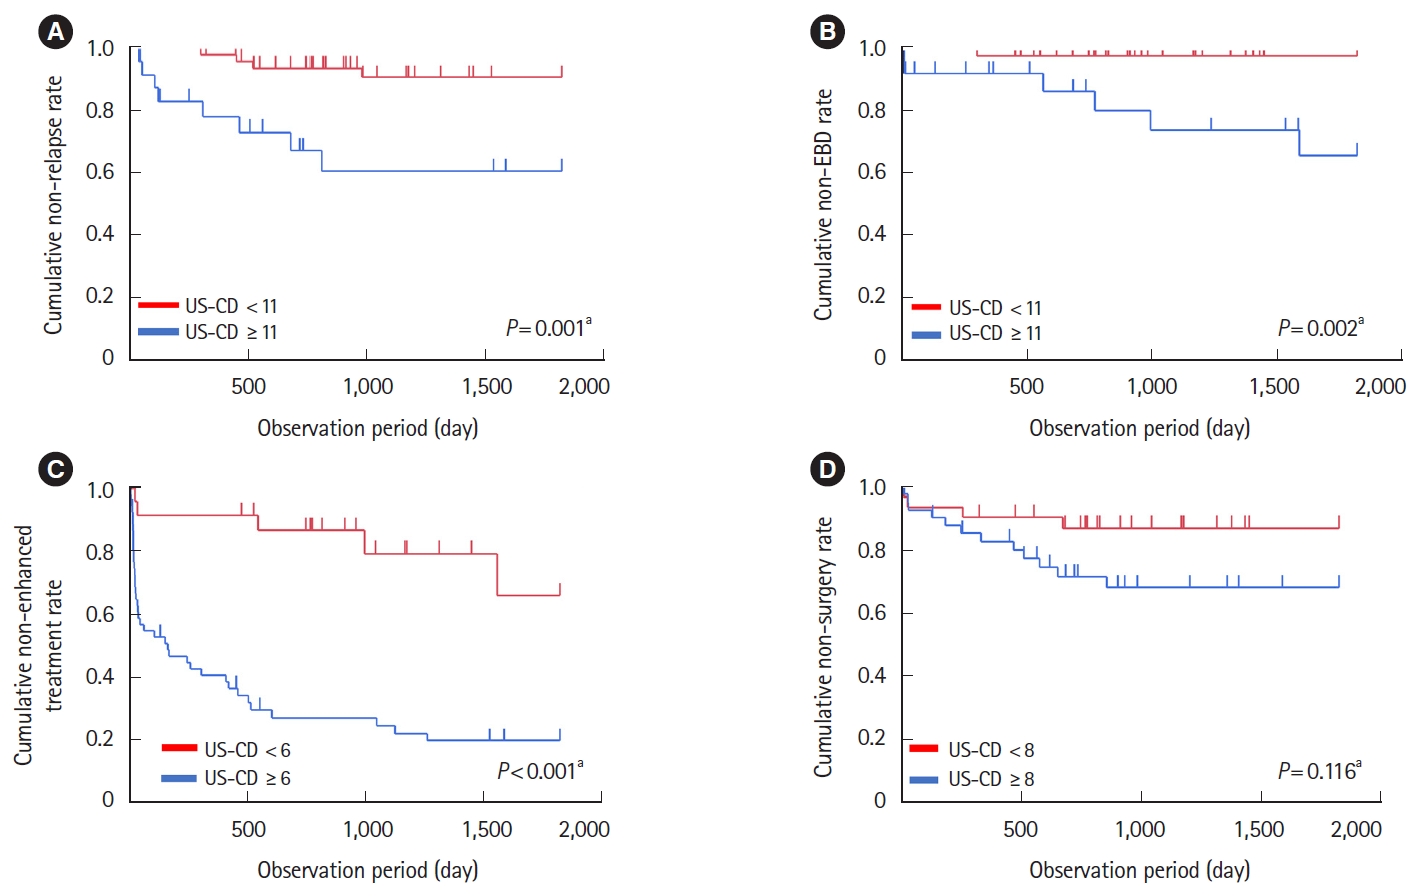
Univariate and multivariate analysis showed that US-CD was a factor associated with clinical relapse (hazard ratio [HR], 1.07; 95% confidence interval [CI], 1.01-1.12; P= 0.005 and HR, 1.05; 95% CI, 1.00-1.09; P= 0.038) (Table 3). In US-CD subscores, univariate analysis showed that the score of BWT, loss of stratification, and presence of stenosis were factors associated with clinical relapse (Table 4). The predictive value of US-CD for clinical relapse was evaluated using ROC curves. AUROC for the prediction of clinical relapse was 0.77, with a US-CD (cutoff value = 11). The sensitivity, specificity, PPV, and NPV were 75%, 66%, 30%, and 93%, respectively. The cumulative clinical relapse rate of patients with US-CD ≥ 11 was significantly higher than that of patients with US-CD < 11 (P= 0.001) (Fig. 2A). Of these 73 patients, 61 remained in clinical remission during the observation period and were included in the remission group. The remaining 12 patients experienced clinical relapse within 5 years and were defined as the relapse group (Supplementary Table 2); with a median time to relapse of 311 days (range, 123-980 days).
3. Endoscopic Balloon Dilation
Univariate analysis showed that US-CD and smoking were factors associated with requiring EBD (HR, 1.07; 95% CI, 1.01-1.14; P= 0.017 and HR, 4.57; 95% CI, 1.02-20.40; P= 0.047) (Table 3). Whereas multivariate analysis showed that US-CD and smoking were not significant factors associated with requiring EBD. Seven patients (fewer than 10) underwent EBD. In USCD subscores, univariate analysis showed that the score of increasing mesenteric fat tissue echogenicity and loss of stratification were factors associated with requiring EBD. The predictive value of US-CD for requiring EBD was evaluated using the ROC curves. AUROC to predict EBD requirement was 0.81 with a US-CD (cutoff value = 11). The sensitivity, specificity, PPV, and NPV were 86%, 73%, 25%, and 98%, respectively. The cumulative EBD requirement rate of patients with US-CD ≥ 11 was significantly higher than that of patients with US-CD < 11 (P= 0.002) (Fig. 2B). Seven patients who underwent EBD within 5 years were included in the EBD group. The remaining 66 patients who did not undergo EBD during the observation period were included in the non-EBD group (Supplementary Table 3). In the EBD group, the median time to undergo EBD was 564 days (range, 7-1,593 days).
4. Enhanced Treatment
Univariate analysis showed that US-CD and baseline biologic use were factors associated with requiring enhanced treatment. Multivariate analysis also showed that US-CD and baseline biologic use were factors associated with requiring enhanced treatment (HR, 1.04; 95% CI, 1.01-1.07; P= 0.005 and HR, 0.34; 95% CI, 0.18-0.64; P= 0.001) (Table 3). In US-CD subscores, univariate analysis showed that BWT score, color Doppler signal, increasing mesenteric fat tissue echogenicity, and loss of stratification were factors associated with requiring enhanced treatment (Table 4). The predictive value of US-CD for the need of enhanced treatment was evaluated using ROC curves. The AUROC for the prediction of enhanced treatment was 0.74 with a cutoff value of 6. The sensitivity, specificity, PPV, and NPV were 89%, 59%, 75%, and 78%, respectively. The cumulative requiring enhanced treatment rate of patients with US-CD ≥ 6 was significantly higher than that of patients with US-CD < 6 (P< 0.001) (Fig. 2C). Forty-three patients who underwent enhanced treatment within 5 years were included in the enhanced treatment group. The remaining 30 patients did not change their treatment during the observation period and were defined as the non-enhanced treatment group (Supplementary Table 4). In the enhanced treatment group, the median time to experience enhanced treatment was 36 days (range, 8-1,559 days).
5. Surgery
Multivariate analysis showed that penetrative disease phenotype was a factor associated with requiring surgery (Table 3). The predictive value of US-CD for surgery requirement was evaluated using ROC curves. The AUROC for predicting surgery requirement was 0.59 with a US-CD (cutoff value = 8). The sensitivity, specificity, PPV, and NPV were 73%, 48%, 27%, and 88%, respectively. The cumulative surgery requirement rate of the patients with US-CD ≥ 8 was not significantly higher than that of patients with US-CD < 8 (P= 0.116) (Fig. 2D). Fifteen patients who underwent surgery within 5 years were included in the surgery group. The remaining 58 patients did not undergo surgery during the observation period and were classified into the non-surgery group (Supplementary Table 5). In the surgery group, the median time to surgery was 255 days (range, 25-856 days).
DISCUSSION
Our study demonstrated that US-CD can predict clinical relapse and the need for EBD in patients with CD. Specifically, patients with US-CD ≥ 11 had a significantly higher occurrence of clinical relapse and EBD within 5 years. In addition, patients with US-CD ≥ 6 demonstrated a significant need for enhanced treatment within 5 years. Univariate analysis revealed a significant association between US-CD and clinical relapse, the need for EBD, and enhanced treatment. Moreover, multivariate analysis showed that US-CD was significantly associated with clinical relapse and the need for enhanced treatment, further affirming its predictive ability in these aspects.
Patients with US-CD ≥ 11 had a significantly higher occurrence of clinical relapse and EBD than patients with US-CD < 11. The cutoff value was higher than the enhanced treatment (11 vs. 6) group, reflecting more severe disease activity. The EBD requirement and clinical relapse shared the same cutoff value of 11, indicating that patients with severe inflammation may experience clinical relapse, develop fibrotic stenosis, and eventually require EBD.
Vaughan et al. [23] and Allocca et al. [29] showed that US inflammation was associated with subsequent enhanced treatment in patients with CD. Consistent with their reports, our study also showed a significant association between US-CD and the need for enhanced treatment in the univariate analysis. Particularly, patients with US-CD ≥ 6 had a notably higher requirement for enhanced treatment. Although we performed multivariate analysis in this study, Cox proportional hazards regression analysis recommends a minimum of 10 events per factor to be included in the multivariate analysis [30,31]. The small sample size of this study may have limited the robustness of the analysis.
There are several US parameters assessing CD activity. Novak et al. [32] showed that BWT, color Doppler signal, increasing mesenteric fat tissue echogenicity, and loss of stratification are required to predict overall disease activity in CD. Additionally, BWT and increasing mesenteric fat tissue echogenicity are needed to predict overall disease severity.
Sævik et al. [33] showed that BWT is a quantitative US parameter with a high inter-observer agreement rate. Vaughan et al. [23] showed that BWT was significantly associated with enhanced treatment, hospitalization, and the need for surgery. Additionally, our study’s BWT score was significantly associated with clinical relapse and enhanced treatment. Thus, BWT is considered the most sensitive finding for inflammation [23,32,33], and our study showed that none of the 5 cases with normal BWT experienced either clinical relapse, enhanced treatment, or EBD during the observation period. Sævik et al. [33] also showed that increased BWT occurs in fibrosis with no inflammation, putting patients at risk of receiving incorrect treatment. In our study, 68 patients had elevated BWT, 23 of whom did not experience any negative outcomes during observation period. Additionally, 10 of 53 patients with elevated BWT and other subscores did not experience any negative outcomes. Therefore, combining elevated BWT and other US findings may be useful in determining the patient’s course of treatment.
Color Doppler signal is quantitative and has a high inter-observer agreement rate, but sensitivity may be reduced in obese populations (body mass index > 30 kg/m2) due to increased ultrasound attenuation with increased tissue depth [33]. However, in our study, the median body mass index was 20.6 kg/m2, which would have little effect on the examination. Vaughan et al. [23] showed that color Doppler signal was significantly associated with enhanced treatment and corticosteroid use but not with hospitalization or surgery requirement. Consistent with their result [23], our study also showed that the color Doppler signal was significantly associated with enhanced treatment but not surgery.
Novak et al. [32] reported that agreement for detection of increasing mesenteric fat tissue echogenicity was also moderate with κ = 0.51 and fair loss of stratification fair with κ = 0.39. In contrast, Sævik et al. [33] excluded evaluations of increasing mesenteric fat tissue echogenicity and loss of stratification due to poor agreement between investigators. Whereas Vaughan et al. [23] reported that these parameters reflected severe inflammation and were significantly associated with enhanced treatment, hospitalization, and the need for surgery. Our study also showed that the scores of these parameters were significantly associated with enhanced treatment and need for EBD. Thus, patients with these parameters may have severe inflammation and subsequent fibrotic stenosis requiring EBD, and may require further explanation on the risk of stenosis. Lichtenstein et al. [34] showed that the frequency of stenosis formation may vary with treatment. In addition, our study may contribute to drug selection.
Vaughan et al. [23] showed that increased mesenteric fat tissue echogenicity and loss of stratification were observed only in patients with increased BWT. Consistent with their findings, our study also showed that these parameters were found only in the patients with a BWT score ≥ 2.
Stenosis is one of the most common complications in patients with CD and is a frequent reason for surgery. Allocca et al. [29] showed that the presence of complications such as stenosis, fistula, or abscess in US at baseline were associated with the need for surgery within 1 year. In our study, the stenosis score was not significantly associated with surgery or the need for EBD. However, consistent with their result [29], in 9 patients who underwent surgery for stenosis, univariate analysis showed that the stenosis score was significantly associated with surgery (HR, 1.72; 95% CI, 1.09-2.60; P= 0.011). Bettenworth et al. [35] stated that at least 2 of 3 findings-luminal narrowing, wall thickening, and pre-stenotic dilation are essential for diagnosing stenosis; therefore, for a more accurate diagnosis, it is necessary to meet these criteria. Additionally, they suggested that US had limited detectability in detecting stenosis without pre-stenotic dilation [35]. The reason EBD was not significantly associated with stenosis may be because EBD was performed for stenoses regardless of pre-stenotic dilation. However, the stenosis score was significantly associated with clinical relapse. This may be attributed to the symptoms of obstruction and may indicate that severe stenosis, which causes such symptoms, is detectable and may be a cause for surgery.
US findings have various characteristics, and combining multiple US findings may lead to a more accurate evaluation. There are validated US activity indices for measuring disease activity in CD, including those developed by Novak et al. [32] and Sævik et al. [33] Both indices consist of the BWT and color Doppler signals. In addition, our results suggested that combining the parameters of increasing mesenteric fat tissue echogenicity and loss of stratification may more accurately reflect the severity of disease activity.
Thus, by combining US with routine medical care, patient conditions can be monitored more objectively and sequentially, which is expected to improve the patient-doctor relationship and increase patient compliance with treatment.
Nonetheless, this study had several limitations. The small number of participants in this study may have limited the robustness of the analyses. Therefore, future studies with larger sample sizes are required. Biomarkers commonly used in recent years, such as fecal calprotectin and leucine-rich α-glycoprotein, could not be included because these tests were not performed for the patients in this study. The US-CD requires external validation before clinical use. Additionally, the findings of increased mesenteric fat tissue echogenicity and loss of stratification raise concerns regarding objectivity. In this study, US was evaluated only transabdominally, and the rectum was excluded because of the difficulty in accurate evaluation. Trans-perineal US can evaluate the rectum more accurately; however, it is not widely used in Japan. The upper small intestine was also not included in this study. Therefore, disease activity in upper gastrointestinal lesions may not have been accurately assessed. Moreover, some patients dropped out of the study due to transfer to other hospitals or poor compliance during the follow-up period. Therefore, we plan to validate the results of this study through future prospective studies with more patients and including analyses of the upper small intestine and rectum.
In conclusion, our study revealed that a high US-CD score was associated with subsequent adverse outcomes in patients with CD, especially for clinical relapse and the need for EBD.