


INTRODUCTION
Colorectal cancer (CRC) is the one of the most common cancer and cause of cancer-related death worldwide, with 1.3 million new cases and 700,000 deaths annually [1]. The incidence and mortality of CRC have also been increasing in Korea, with agestandardized incidence of 37.3/100,000 and mortality rate of 9.7/100,000 [2]. Most CRCs arise from premalignant lesions, such as colorectal adenoma (CRA) and especially, advanced adenoma, for 5 to 10 years [3]. Therefore, if CRA is detected and treated by screening colonoscopy, most CRCs can be prevented [4,5].
In many countries, including Korea, fecal occult blood test (FOBT) and colonoscopy have been used for CRC screening starting at 50 years of age [6]. Even with repeat FOBT, significant number of CRCs and premalignant adenomas may be missed owing to low sensitivity [7]. Colonoscopy is considered the most sensitive and convenient method for CRC screening because it can treat CRA in one stage. However, it is an expensive and invasive procedure that can induce bleeding and perforation. Therefore, identifying high risk subjects with advanced colorectal neoplasm (ACRN) who need screening colonoscopy is very important.
Several risk scoring models have been recently developed for identifying high risk subjects who need screening colonoscopy [8,9]. However, these models targeted subjects aged >50 years. The incidence and prevalence of CRC have been increasing in subjects aged <50 years, and the need for developing models targeting this age group is being raised [10-12]. Therefore, this study aimed to develop and validate a scoring system for ACRN in a large cohort comprising Korean subjects aged <50 years who underwent screening colonoscopy.
METHODS
1. Study Population for Development of the Risk Score
Asymptomatic subjects aged <50 years who underwent a health examination between 2003 and 2012 at a single comprehensive health care center were enrolled. Exclusion criteria were as follows: incomplete colonoscopy, history of CRC or other cancers, history of IBD, history of previous colonoscopy, colorectal surgery, or missing clinical or laboratory data. Finally, 59,575 subjects were included with different characteristics by examination years. Thus, the dataset was randomly divided into the derivation (70%) or validation (30%) cohort by examination years. The derivation cohort included 41,702 subjects, and the validation cohort included 17,873 subjects.
This study was approved by the Institutional Review Board of Kangbuk Samsung Hospital (IRB No., 2013-01-119) and written informed consents were obtained.
2. Measurements and Diagnosis of Colorectal Neoplasm
Data on medical history, medication use, and health-related behaviors were collected using a self-administered questionnaire under the supervision of a well-trained interviewer. Data on alcohol consumption and smoking were noted. A heavy drinker was defined as a subject who drinks >4 times per week regularly. Family history of CRC was defined as CRC in 1 or more first-degree relatives at any age. Weekly frequency of moderate to vigorous physical activity was also assessed.
Physical measurements and serum biochemical parameters were measured by trained nurses. The Asia-Pacific criteria for obesity based on BMI guidelines were used to diagnose obesity (BMI ≥25 kg/m2) [13]. Blood pressure was measured using a standard mercury sphygmomanometer with subjects seated after at least 10 minutes of rest. Blood samples were obtained from the antecubital vein after at least 10 hours of fasting. Colonoscopies were performed by experienced colonoscopists who were unaware of the present study. Bowel preparations were performed using 4 L of polyethylene glycol solution. Histological assessment of all polyps was performed by experienced pathologists who were unaware of the subjects’ clinical data. ACRN was defined as CRA ≥10 mm in diameter, CRA with any component of villous histology, high-grade dysplasia, or carcinoma [14].
3. Development of the Risk Scoring System
The authors developed the Young Colorectal Screening (YCS) score to identify high risk subjects aged <50 years for ACRN. Univariable analysis was performed for the derivation cohort using the chi-square test or t-test to assess the association between clinical variables and ACRN. Variables associated with ACRN in the univariable analyses (P<0.05) were included in the multivariable logistic regression analysis. Potential risk variables that were significant in the multivariable analysis with stepwise selection procedure based on Akaike information criterion were included in the risk score. We assigned weighted points to each risk factor. Each risk point was rescaled to designate the point of current obesity as one (e.g., the risk point for age between 40 and 50 years was 3, which was rounded from 0.676/0.485 =2.808). The risk score for an individual was the summation of their individual risk factors. The validity of the score was assessed by receiver operating characteristic (ROC) curve analysis.
4. Calculation and Validation of the Risk Scoring System
Each individual had a personal risk score calculated by the R software that summed the points attributed based on the presence of a risk factor in the individual. The score was calculated using the R software at the data center after data were sent from individual clinical study sites. The performance of the risk scoring system was evaluated by comparing the OR of the high-risk (HR) and moderate-risk (MR) tiers versus the low-risk (LR) tier or HR tier versus MR and LR tiers from 3 categories.
5. Statistical Analyses
In the derivation cohort, univariable analysis was performed to assess the associations between clinical variables and ACRN using the chi-square test for categorical variables, namely sex, alcohol consumption, smoking, family history of CRC, exercise, obesity, and diabetes, and the t-test for continuous variables, namely age, HDL-cholesterol, lowdensity lipoprotein-cholesterol, total cholesterol, systolic blood pressure, diastolic blood pressure, insulin, triglyceride, hemoglobin A1c (HbA1c), and glucose. Multivariable logistic regression analysis with stepwise selection was used to select ACRN predictors. Initial candidate variables were those with P-value <0.05 in the univariable analyses. To predict the presence of ACRN, we designed a prediction rule with the clinical variables selected in the multivariable analyses. The Hosmer-Lemeshow statistic was used to determine the goodness-of-fit of the logistic regression model, a low P-value (< 0.05) indicating a lack of fit of the model. A new logistic regression model was implemented with transformed variables, which were obtained by converting continuous variables. The risk prediction rule was developed from the new logistic regression equations using the beta coefficient-based scoring method. We assigned weighted points to each risk factor. On the basis of the lowest beta coefficient, other factors were rescaled and rounded to the nearest integer. The total score for each individual was calculated by summing the scores of all individual risk factors. The area under the ROC curve was then computed to assess the ability of the risk scoring system.
In the derivation cohort, we chose the score that was divided into 3 tiers (HR, MR, and LR) as the cutoff value and then calculated the sensitivity, specificity, and balanced accuracy of the prediction rule to evaluate predictive accuracy. The prediction rule was also validated in the validation cohort. We compared the performance of the risk prediction rule, as measured by sensitivity, specificity, and balanced accuracy, against existing methods such as Asia-Pacific colorectal Screening (APCS) score [9] and Korean Colorectal Screening (KCS) score [15]. To compare the statistical ability of the YCS, APCS, and KCS scores in predicting the risk of ACRN in the validation cohort, ROC analysis and McNemar test were performed. Statistical analyses were performed using R and MedCalc for Windows, version 16.2 (MedCalc Software, Ostend, Belgium).
RESULTS
1. Characteristics of Subjects in the Derivation and Validation Cohorts
The deviation cohort included 41,702 asymptomatic subjects (mean age, 38.9 ± 5.3 years; males, 71.4%), of which 393 (0.9%) had ACRN and 18 (0.04%) had CRC. The baseline characteristics of the patients are described in Table 1. The validation cohort included 17,873 asymptomatic subjects (mean age, 38.9 ± 5.4 years; males, 71.2%), of which 169 (0.9%) had ACRN and among them, 7 (0.04%) had CRC (Table 1).
3. New Logistic Regression Model and Development of the Risk Score
In the present study, the risk factors associated with ACRN were assessed originally using the new logistic regression model to develop a precise and practical risk scoring model. Male sex (OR, 1.22; 95% CI, 0.95-1.56), age 40 to 49 years (OR, 2.04; 95% CI, 1.66-2.52), heavy drinker (OR, 1.40; 95% CI, 1.13-1.74), current smoking (OR, 1.41; 95% CI, 1.14-1.75), obesity (OR, 1.29; 95% CI, 1.04-1.59), glucose level ≥ 100 mg/dL or HbA1c ≥ 6.5% (OR, 1.55; 95% CI, 1.24-1.93), and family history of CRC (OR, 1.09; 95% CI, 0.66-1.80) were included in the YCS scoring model for ACRN. Male sex and family history of CRC were not statistically significant factor in the present study; however, these factors were revealed to be important risk factors in previous studies. Therefore, 1 point was assigned for each factor. A point for the YCS score of each risk factor was assigned as follows: female sex (0), male sex (1), age <40 years (0), age 40-49 years (3), never or non-heavy drinker (0), heavy drinker (1), never or former smoker (0), current smoker (1), non-obesity (0), obesity (1), glucose level <100 mg/dL and HbA1c <6.5% (0), HbA1c ≥ 6.5% or glucose level ≥ 100 mg/dL (1), absent of family history of CRC (0), and present of family history of CRC (1) (Table 3).
The YCS score was represented with the sum of points for risk factors present in an individual in the present study. The score was composed of a range from 0 to 10 points. Subjects with ACRN showed an increasing tendency as the risk score increased proximately. However, no subject with a score of 10 had ACRN (Table 4). The score was classified into 3 tiers according to the risk of ACRN. Scores from 0 to 4 were assigned as LR tier, that from 5 to 7 were assigned as MR tier, and that from 8 to 10 were assigned as HR tier. There were 28,051 subjects (67.3%) in the LR tier, 23,427 subjects (29.8%) in the MR tier, and 1,224 subjects (2.9%) in the HR tier. Subjects with scores of MR and HR had increased risks of ACRN (OR, 2.5; 95% CI, 2.1-3.1 and OR, 2.9; 95% CI, 1.9-4.5, respectively) (Table 5). The prevalence of ACRN was 0.6% in the LR tier, 1.6% in the MR tier, and 1.8% in the HR tier. The area under the curve (AUC) for the ACRN risk score in the derivation cohort was 0.641, indicating good discrimination.
4. Validation of the Risk Scoring Model for ACRN in Young Adults
Among the 17,873 subjects in the validation group, 12,099 (67.7%) were classified into the LR tier, 5,245 (29.3%) into the MR tier, and 529 (3.0%) into the HR tier. In the derivation cohort, 176 subjects (0.6%) had ACRN in the LR tier, 195 (1.6%) had ACRN in the MR tier, and 22 (1.8%) had ACRN in the HR tier. In the validation cohort, 78 subjects (0.6%) had ACRN in the LR tier, 78 (1.5%) had ACRN in the MR tier, and 18 (3.4%) had ACRN in the HR tier. In the validation cohort, the risk of ACRN was higher in the MR tier (OR, 2.5; 95% CI, 1.8-3.4) and HR tier (OR, 5.8; 95% CI, 3.4-9.8) than in the LR tier (Table 5). The Hosmer-Lemeshow goodness-of-fit statistic was used to test the validation cohort, and a P-value of 0.261 indicated a fair match of predicted risk over observed risk. The AUC value was 0.660, indicating good discrimination.
5. Diagnostic Performance of ACRN by Risk Category in Young Adults
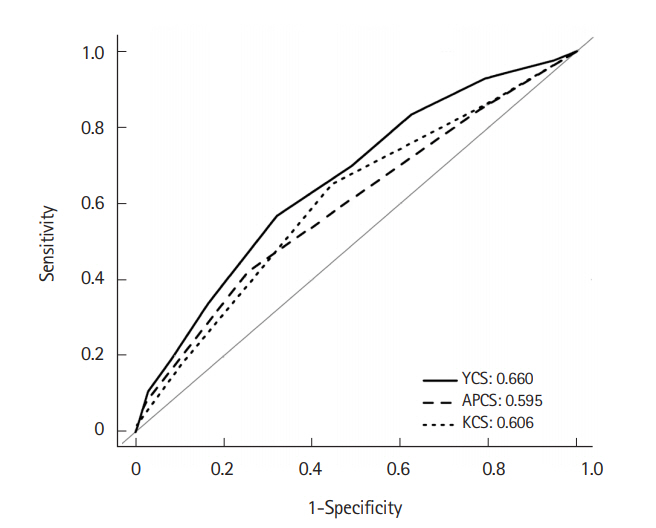
Diagnostic performance of the YCS score for detecting ACRN in the validation cohort was also assessed. The YCS score was compared with the APCS and KCS scores. Participants for the APCS score were enrolled in 11 Asian cites and had a mean age of 54.4 ± 11.6 years. Points were assigned to each risk factor for ACRN as follows: age ≥ 70 years (3), age 50-69 years inclusive (2), age <50 years (0), male sex (1), female sex (0), family history of CRC in a first-degree relative present (2) or absent (0), non-smoking (0), and smoking (1). The score ranged from 0 to 7 and was divided into 3 risk tiers: score 0-1, low risk (LR); score 2-3, MR; and score 4-7, HR. The mean age of patients enrolled for the KCS score was 51.3 ± 9.0 years, and the points of KCS score were assigned as follows: age ≥70 years (4), age 50-69 yeas inclusive (2), age <50 years (0), male sex (1), female sex (0), family history of CRC in a first-degree relative present (1) or absent (0), current or past smoker (1), nonsmoker (0), BMI ≥ 25 kg/m2 (1), and BMI <25 kg/m2 (0). This score ranged from 0 to 8 and was divided into 3 risk tiers: score 0-1, LR; score 2-3, MR; and score 4-8, HR. On comparing between HR tier and MR+LR tier, the newly proposed YCS score showed slightly lower specificity (97.1%) than the APCS and KCS scores (99.4% and 99.7%, respectively). However, sensitivity (10.7%) and balanced accuracy (53.9%) were more precise than those of the APCS score (3.6% and 51.5%) and KCS score (1.8% and 50.7%). On comparison between MR+HR tier and LR tier, balanced accuracy was also higher in the YCS score (62.4%) than in the APCS score (58.3%) and KCS score (60.3%) (Table 6). McNemar test results showed that the YCS score (10.7%) had a higher sensitivity than the APCS (3.6%, P=0.014) and KCS (1.8%, P=0.001) scores when the HR tier was compared with MR+LR tier. Specificity in the YCS score (97.1%) was lower than that in the APCS (99.4%, P<0.001) and KCS (99.7%, P<0.001) scores. When HR+MR tier was compared with LR tier, YCS score showed higher sensitivity (56.8%) than APCS score (42.0%, P=0.002) and higher specificity (67.9%) than KCS score (55.5%, P<0.001) (Table 7). In the ROC analysis, AUC for the risk score was significantly higher in the YCS score (0.660; 95% CI, 0.65-0.67) than the APCS (0.595; 95% CI, 0.59-0.60; P=0.007) and KCS (0.606; 95% CI, 0.60-0.61; P=0.012) scores when the results of APCS and KCS score were obtained using the validation cohort of the present study (Fig. 1).
DISCUSSION
Early detection and treatment of CRC is associated with a reduction in CRC mortality. Screening colonoscopy and polypectomy have decreased the incidence and mortality of CRC [5,16]. CRC and precancerous ACRN should be targeted by CRC screening. The present study developed and validated the YCS score with multiple clinical and laboratory factors, including age, sex, social behaviors, metabolic factors, and family history of CRC. This is the first study to assess the ACRN screening score foe patients aged <50 years in a large Asian cohort.
Many studies have evaluated age as an important risk factor for the development of CRA and CRC [8,17]. Most studies revealed that the prevalence of CRC increased in subjects aged ≥50 years; therefore, these subjects were considered as targets for CRC screening in most of countries [6,18]. However, there is a chance of CRC developing in adults aged <50 years, and 1% of asymptomatic subjects had ACRN, including precancerous lesions, in the present study. A previous study reported that ACRN was found in 0.7% of patients in the 30 to 39-year age group, which increased to 2.7% of patients in the 40 to 49-year age group [19]. It is difficult to screen all young adults due to the lower prevalence of CRC in young adults than that in older adults considering the cost-benefit problems and complications. Therefore, it is important to identify high risk subjects and also include young adults in the screening. In the present study, the risk of ACRN increased as the age increased, even in young adults aged <50 years. Therefore, screening of ACRN should be considered for young adults as they age, especially for subjects with other risk factors.
Previous studies evaluated risk factors of ACRN, including age [8,14], male sex [20], smoking [21], and family history of CRC in firstdegree relatives [22]. Several CRC screening scoring models including those factors were developed [23-25]. Recently, metabolic factors, including obesity [26], diabetes mellitus, and dyslipidemia [27], were reported as a risk factor of CRA and CRC. However, a small number of scoring models included metabolic factors, and few models used quantitative laboratory results. In the present study, metabolic factors, including obesity, glucose metabolism abnormality, dyslipidemia, and blood pressure, were quantitatively evaluated, and using these factors, the YCS score was developed. The risk of ACRN increased in subjects with obesity and HbA1c ≥ 6.5% or glucose level ≥100 mg/dL. Obesity influences the development of CRC [28], and BMI was included as a risk factor in previous CRC screening scoring systems [8,23,29]. In Asia, obesity is less prevalent, and the mean BMI is also lower than that in Western countries [30]. In our study, the overall mean BMI was 23.8±3.2 kg/m2, and extremely obese subjects with BMI >30 kg/m2 were rare. Obesity increased the risk of ACRN through insulin resistance and chronic inflammation [31]. BMI was not included in the APCS score; however, it was included in the KCS score. In the YCS score, BMI was assigned 1 point, and this more clearly reflected the increased risk of ACRN according to metabolic abnormality. Glucose metabolism is also related to CRC. Insulin-like growth factor-1 (IGF-1) level increases due to hyperinsulinemia, resulting from insulin resistance, and elevated IGF-1 levels affect the incidence of CRA and CRC, inducing proliferation and dysplasia of normal and carcinoma cells owing to insulin resistance abnormality [32]. Meta-analysis of published studies supported a protective association between antidiabetic medications and CRC risk in patients with diabetes mellitus [33]. Strict regulation of HbA1c and fasting glucose levels might be more important in the development of CRA and CRC. The risk of ACRN might be increased with glucose metabolism abnormality before the development of diabetes mellitus. Some previous studies reported that abdominal obesity and metabolic syndrome seemed to be related to the risk of colorectal neoplasm in younger subjects but not in older individuals [31,34]. Therefore, in subject aged < 50 years, the YCS score, which included obesity and HbA1c and fasting glucose levels, could be more accurate and valuable for CRC screening.
In the present study, multiple factors, which were previously known as risk factors for ACRN, were accurately evaluated by questionnaires and laboratory tests. Laboratory tests used in the YCS score were generally used in the clinical practice. They could be quantitatively measured and represented the present patient’s clinical state. The YCS score was constructed using multivariate analysis with multiple risk factors, so that it was valuable in the practical clinical field. The YCS score comprised factors that could be obtained relatively easily with precise information from subjects. It was an easily calculated score, and the stratification of risk groups was also simple. All study subjects were asymptomatic, of low risk, had first colonoscopy, enrolled in a screening setting, and were representative of our general screening target population. Therefore, the YCS score can be helpful for CRC screening that targets subjects who need a colonoscopy and are aged <50 years.
In the present study, around 33% subjects belonged to the MR+HR tier, and the prevalence of ACRN was 1.5% among those subjects. In case of the HR tier, the proportion of subjects was 3%, and the prevalence of ACRN was around 2% to 3%. In the study of APCS score, the prevalence of ACRN in subjects aged >50 years was around 3.5% to 5% [9], and in another study of our group, which comprised 10,000 asymptomatic subjects aged >50 years, the total prevalence of ACRN was around 3.7%, that of male patients was around 4.7%, and that of female patients was around 2.3% [35]. This prevalence of ACRN was similar to that of the HR tier in the present study. Considering the prevalence of ACRN and medical cost-effectiveness in asymptomatic subjects aged <50 years, it was effective that colonoscopy screening was recommended in the HR tier of YCS score, and FOBT might be recommended first in the MR tier. When results of the APCS and KCS scores were obtained using the validation cohort of the present study, only 0.3% to 0.7% of total subjects were classified into the HR tier, which represented a relatively small proportion for colonoscopic screening. The sensitivity was only lower than 4%. A previous study using the KCS score recommended that adults aged <50 years undergo CRC screening if their scores place them in either the MR or HR tier [15]. However, the proportion of subjects in the MR and HR tiers in the KCS score was around 45%. The targets of screening colonoscopy will increase when KCS scores are used to screen subjects aged <50 years. When we considered cost-effectiveness, KCS scoring could be ineffective in screening for ACRN because of the broad target population. When we compared between HR and MR+LR (or MR+LR) among the 3 scores, the specificity of YCS score was slightly lower than those of APCS and KCS scores. However, sensitivity and balanced accuracy were significantly higher of YCS score than of APCS and KCS scores. Sensitivity is more important for screening than specificity. Specificity was only 2% lower for YCS score than for APCS or KCS score. Specificity is also less crucial than sensitivity because of the low prevalence of ACRN in subjects aged <50 years. The YCS score was also more discriminative than the APCS and YCS scores in the ROC analysis. Therefore, YCS score would be more effective and valuable for assessment of high risk you adult subjects for ACRN screening.
The present study had several limitations. It was a cross-sectional study with a single ethnic group. The prevalence of ACRN in Asian countries is lower than that in Western countries, and it is definitely low in subjects aged <50 years [34,36]. The absolute value and prevalence of obesity are higher in Western countries than in Asian countries, and the metabolic profile is also probably different. The results of our study cannot be generally applied. However, the YCS score, which included metabolic factors, might be useful in Western subjects because of the high prevalence of ACRN and metabolic abnormality in them. Validation of the YCS score with various subjects are needed. Data on smoking, alcohol intake, and exercise were evaluated by simple questionnaires and not quantitatively. Data collection was difficult because this was a large-scale populationbased study. However, we collected various anthropometric measurements and metabolic laboratory factors, which are frequently used in clinical practice for all study participants. This provided valuable risk factors, which are crucial for determining screening strategies. Considering the distribution of participants for the YCS score, 2 subjects each had a score of 10 in the derivation and validation cohorts; however, ACRN was not detected in subjects with a score of 10. This could be a result of the small sample size of the score group; however, those subjects might not have developed ACRN yet because they were younger than 50 years and there could be a great possibility of developing ACRN after 50 years of age. AUC of the YCS score increased statistically compared with that of the APCS and KCS scores. However, the increment in AUC was only about 0.05, and AUC of 0.660 itself did not seem very high. The prediction of the risk stratification of ACRN was not easy, so AUC of previous scoring systems, including APCS and KCS scores, were only 0.6. However, AUC of YCS score increased to about 0.05 using simple clinical factors that could be easy to identify. Some of the false positive and negative results were reduced through increased AUC, the cost-effectiveness of the ACRN screening could be increased.
In conclusion, the YCS score was developed and validated for screening risks of ACRN using age, sex, alcohol consumption, smoking state, obesity, glucose metabolism abnormality, and family history of CRC in a large cohort of asymptomatic subjects aged <50 years. The prevalence of ACRN was lower in subjects aged <50 years than in those aged ≥50 years. However, in the HR tier of the YCS score, risks of ACRN increased even in subjects aged <50 years. Therefore, the YCS score could be valuable for colonoscopic screening among young adults.