The prevalence of sarcopenia and its effect on prognosis in patients with Crohn’s disease
Article information

Abstract
Background/Aims
Crohn’s disease is associated with altered body composition, such as low muscle mass, which can affect clinical outcomes. However, there are few studies regarding the effect of sarcopenia on prognosis of Crohn’s disease. In this study, we evaluated the body composition at the initial diagnosis of Crohn’s disease and analyzed the clinical meaning of sarcopenia.
Methods
We conducted a retrospective review of medical records of patients who were diagnosed as Crohn’s disease and underwent computed tomography within 3 months after diagnosis. Sarcopenia was defined as an L3 skeletal muscle index (SMI) of < 49 cm2/m2 for men and < 31 cm2/m2 for women. Outcomes such as need for hospitalization, surgery, use of steroids, immunomodulators and biologics were analyzed.
Results
A total of 79 patients (male, 73.4%; mean age, 29.9 years) were included and 40 patients (51%) were diagnosed as sarcopenia. C-reactive protein (CRP) level was correlated with sarcopenia (P= 0.044). Erythrocyte sedimentation rate (ESR) showed a tendency to decrease inversely with SMI (r = –0.320, P= 0.008) and hemoglobin and albumin tended to increase in proportion to SMI (hemoglobin: r = 0.271, P= 0.016 and albumin: r = 0.350, P= 0.002). However, there was no statistically significance in time-to-first-event analysis in aspects of sarcopenia.
Conclusions
Approximately 50% of patients with newly diagnosed as Crohn’s disease had sarcopenia. CRP levels were higher in the sarcopenia group and SMI correlated with ESR, hemoglobin, and albumin. However, none of prognostic values were demonstrated.
INTRODUCTION
Crohn’s disease (CD) is a chronic immune-mediated GI disorder that the incidence and prevalence are increasing worldwide [1]. The mortality risk is approximately 50% greater than the normal population [2]. It is known to be affected by multiple factors including nutritional and metabolic derangement of patients [3-5].
Sarcopenia, affected by malnutrition, immobility, and chronic catabolic diseases has been reported as a key factor that is associated with morbidity, mortality in elderly people [6,7]. Moreover, recent studies showed that sarcopenia has association with poor outcomes in cancer patients [8]. In similar concept, several studies have been performed to predict the outcomes of CD patients according to sarcopenia. It was reported that sarcopenia is the predictive factor of surgical outcomes in CD patients [9,10]. However, the results of need for surgery with or without sarcopenia were controversial [11,12]. In addition, there were very few studies performed with enrollments of patients at initial diagnosis. Given this background, we performed a quality project for outcomes of newly diagnosed CD patients in aspects of sarcopenia.
The aim of this study was to clarify the prevalence of sarcopenia among CD patients and reveal the predictive values of sarcopenia in impacts on prognostic outcomes.
METHODS
1. Study Subjects
The electronic medical records and radiology database were searched for patients with newly diagnosed as CD between March 2013 and March 2017 at Seoul National University Bundang Hospital. The inclusion criteria were as follows: ≥ 18 years old; diagnosis of CD based on clinical, endoscopic, radiological examination; availability of an accurate height, weight and CT data within 3 months after diagnosis. Subjects were excluded if: they had a medical history of having biologics, steroid or immunomodulators for other significant comorbidities except CD; they got a previous history of bowel surgery; they had cancer history or other chronic disease
2. Definition of Sarcopenia
L3 vertebral level at CT was used for segmentation of body composition [13,14] such as skeletal muscle areas (SMA), visceral fat areas (VFA) and subcutaneous fat areas (SFA). As method of analysis, regions of interest were calculated according to brightness and chromatic contrast (Fig. 1) using the MagicWand tool of PhotoshopTM (Adobe Systems, San Jose, CA, USA). The skeletal muscle index (SMI), which defines sarcopenia, is the SMA divided by the height squared. To evaluate the rational prevalence and prognosis of sarcopenia in Korean patients with CD, we analyzed the data using Korean specific cutoff values of < 49 cm2/m2 for men and < 31 cm2/m2 for women [14,15].
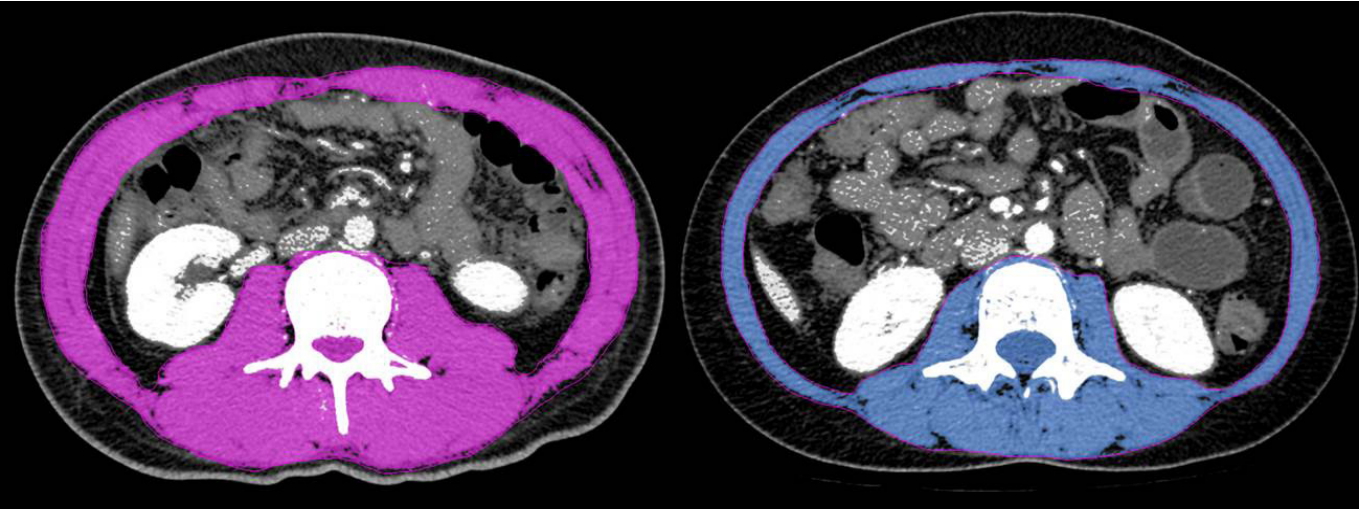
The skeletal muscle area (SMA) measured at the L3 vertebral level. The skeletal muscle index, which defines sarcopenia, is the SMA divided by the height squared. Purple is SMA measured in patients with CD without sarcopenia and blue is SMA measured in patients with CD with sarcopenia.
3. Measurements of Clinical Parameters
To determine the associated factors with sarcopenia status in CD patients, the following variables were analyzed: age, sex, height, weight, smoking history, disease characterization according to the Montreal classification, laboratory test (serum CRP, ESR, albumin, hemoglobin, and vitamin D). Data obtained from dual-energy X-ray absorptiometry (GE Lunar Prodigy; Madison, WI, USA) was used to evaluate bone mineral density (BMD). The lowest BMD t-score at either site such as lumbar spine, femur neck or total hip was used to determine CD patients as normal ( > −1), osteopenic ( ≤ −1 and > −2.5), or osteoporotic ( ≤ −2.5) [16]. Prognostic outcomes were need for operation, hospitalization and first prescription of medication such as biologic drugs (infliximab or adalimumab), immunomodulators (methotrexate or azathioprine), and corticosteroids.
4. Statistical Analysis
The data of the patients were analyzed according to sarcopenia status using the Student t-tests for continuous variables and the chi-square or Fisher exact tests for categorical variables. Correlations between the SMI and clinical variables were assessed using Pearson test. To investigate the prognostic outcomes and determine the statistical difference between groups, Kaplan-Meier methods and log-rank test were used. Univariable Cox proportional hazard models were used to reveal risk factors that affect the prognosis of CD patients. A twosided P-value of < 0.05 was considered statistically significant. Statistical analyses were performed using the IBM SPSS Statistics software version 20.0 (IBM Corp., Armonk, NY, USA).
5. Ethical Considerations
The study was conducted in accordance with the Declaration of Helsinki for the participation of human subjects in research. It was approved by the International Review Board (IRB) of Seoul National University Hospital (IRB No. B-1708-412-108). Written informed consents were obtained.
RESULTS
A total of 79 patients (male, 73.4%; mean age, 29.9 ± 11.3 years) were included and all of their ethnicity were Korean. Prevalence of sarcopenia was 51% (40 patients) according to Korean specific cutoff values. The baseline characteristics of patients with or without sarcopenia are compared in Table 1. Overall mean SMI was 45.1 ± 8.6 cm2/m2 and sarcopenia was revealed to be significantly associated with a male sex (P= 0.018), high height (P= 0.008), lower SFA (P= 0.022) in clinical parameters. Only higher level of CRP showed significant association with sarcopenia among laboratory tests (P= 0.044). There were no significant differences between 2 groups in aspects of Montreal classification except the presence of perianal disease (P= 0.003).

Baseline Characteristics of Subjects Who Were Diagnosed as CD with and without Sarcopenia
Dual-energy X-ray absorptiometry was performed in 28 patients. Among them, patients with BMD t-score of ≤ −1 (osteopenia/porosis) and ≤ −2.5 (osteoporosis) were 23 (82.1%) and 4 (14.3%) respectively. However, none of those showed significant association with sarcopenia.
Correlation between SMI and clinical variables in patients with CD were shown Table 2. Sex (r = 0.646), height (r = 0.382), BMI (r = 0.383), VFA (r = 0.239), hemoglobin (r = 0.271), albumin (r = 0.350) and lower ESR level (r = –0.320) showed tendencies to increase in proportion to SMI. Median follow-up of all patients enrolled was 34.8 months. A Kaplan-Meier analysis was used to calculate the cumulative operation-free survival rate, hospitalization-free survival rate, biologics-free survival rate, immunomodulators-free survival rate, and corticosteroid-free survival rate. However, none of results showed significant differences between groups with or without sarcopenia (Fig. 2). Moreover, none of clinical data including SMI affects hazard ratio of survival curve in Cox regression model.

Correlations between SMI and Clinical Parameters
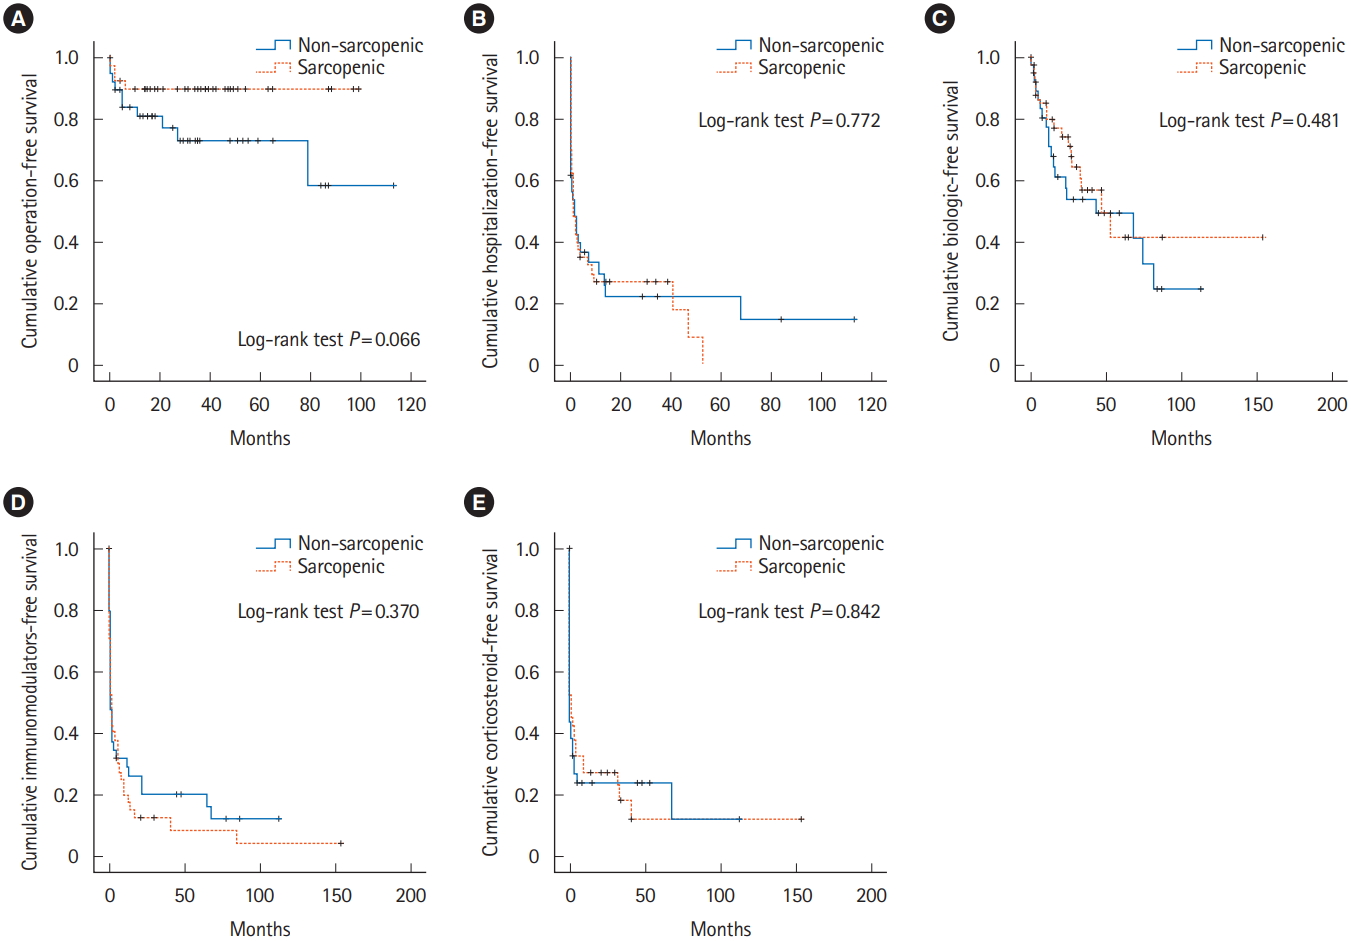
Time-to-first-event analysis by Kaplan-Meier methods in patients with or without sarcopenia: cumulative operation-free survival rate (A), hospitalization-free survival rate (B), biologics-free survival rate (C), immunomodulators-free survival rate (D), and corticosteroid-free survival rate (E).
DISCUSSION
The present study examined the prevalence of sarcopenia among CD patients which was much higher than the prevalence in healthy aging adults [17]. In addition, this prevalence of 51% in patients who were initially diagnosed as CD was in the range (45%–61.4%) of results from previous reports which enrolled patients who are on treatment [9,11,12,18].
Recent studies revealed that skeletal muscle volume is associated with age, sex, height, BMI, and serum CRP, albumin levels which could be considered to reflect chronic inflammation, malabsorption or intestinal deformities [9,11,12,19]. However, our study showed no association between age and sarcopenia. It can be explained in part by the inclusion criteria of firstly diagnosed CD which resulted the population be mostly young. Although some parameters such as serum albumin did not show the significant relationship according to sarcopenia, these were correlated with SMI. This phenomenon can be explained by the difference in cutoff values of each study. In addition, results were in line with previous studies because SFA was significantly higher in patients without sarcopenia while VFA was not related to skeletal muscle volume status [9].
To demonstrate the prognostic value of sarcopenia, we performed time-to-first-event analysis such as operation, hospitalization, use of biologics, immunomodulators, and steroids. However, none of results showed statistically significance. Study by Adams et al. [11] also showed similar results in aspects of need for surgery, hospitalization, or new biological medication in CD patients. In a subgroup analysis of overweight (BMI ≥ 25 kg/m2) patients by Adams et al., sarcopenia predicted need for surgery. Although the result was statistically proven, the number of overweight patients with sarcopenia were small (n = 8). Moreover, the number must be much less in patients who also underwent surgery. In the present study, patients with both sarcopenia and obesity were only 3. To demonstrate the significance, further study with larger population will be necessary. In addition, the difference in the study by Adams et al. in aspects of the prevalence might be resulted by limited population who performed abdominal CT within 3 months of the anti-TNF-α medication initiation.
It is interesting that in a cumulative operation-free survival rate analysis by Bamba et al. [12], there was significant association between sarcopenia and intestinal resection in CD patients. We included patients with newly diagnosed as CD whereas Bamba et al. enrolled patients who admitted to hospital because of exacerbation of IBD. In aspects of finding prognostic factors that affect long term disease progression and helping the clinician what to focus on for the patients practically in initial diagnosis setting, it would be much important to obtain data at the start point of treatment. In addition, the study by Bamba et al. [12] analyzed the data of only 43 patients with CD.
The first strength of this study was that we enrolled newly diagnosed CD patients and attempted to evaluate the prognostic value of baseline status according to sarcopenia in initial setting of treatment start. Second, present study included commonly used medication in time-to-first-event analysis. It enables us to know that there were no association between sarcopenia and need for steroid, biologics or immunomodulators in follow-up period. The third strength is that the cutoff value of sarcopenia was specifically considered for ethnicity whereas cutoff of other previous study was not [9]. In addition, the definition was previously proven and widely used in several other studies which included Korean population [20,21].
This study has a few limitations. First, this was a retrospective analysis and was from a single center. Owing to the absence of controls, it may have affected the results. However, following the international guidelines, a strategy of using medication for CD and decision for surgery is standardized in our tertiary care, university-affiliated hospital. Second, due to the retrospective nature of this study, patients without CT data within 3 months were excluded. Finally, we could not analyze the data of CDAI according to baseline sarcopenia status [22]. There were difficulties in obtaining accurate information of symptoms and general well-being by searching the electronic medical records. Further prospective research will be needed to overcome these limitations of retrospective nature.
In conclusion, this study revealed that baseline status of sarcopenia is present in approximately 50% of patients with newly diagnosed CD. However, the sarcopenia status is not a prognostic factor for predicting need for surgery, hospitalization, initiation of steroids, immunomodulators, or biologics.
Notes
FINANCIAL SUPPORT
The authors received no financial support for the research, authorship, and/or publication of this article.
CONFLICT OF INTEREST
No potential conflict of interest relevant to this article was reported.
AUTHOR CONTRIBUTION
Conception and design: Lee CH, Yoon H. Data acquisition: Lee CH, Yoon H. Data analysis and interpretation: Lee CH, Yoon H. Drafting the manuscript: Lee CH Critical revision of the manuscript and supervision: all authors. Approval of final manuscript: all authors.