The novel latex agglutination turbidimetric immunoassay system for simultaneous measurements of calprotectin and hemoglobin in feces
Article information

Abstract
Background/Aims
Fecal calprotectin (Fcal) as well as the fecal immunochemical test (FIT) are useful biomarkers for detecting activity and mucosal healing in inflammatory bowel diseases. Here, we report the performance of simultaneous measurements of Fcal and FIT for ulcerative colitis (UC) patients using the newly-developed latex agglutination turbidimetric immunoassay (LATIA) system.
Methods
Fcal and hemoglobin were measured by the LATIA system in 152 UC patients who underwent colonoscopy. Fcal was also quantified with a conventional enzyme-linked immunosorbent assay (ELISA). Fecal markers were evaluated in conjunction with the mucosal status of UC, which was assessed via the Mayo endoscopic subscore (MES) classification.
Results
The LATIA system could quantify calprotectin and hemoglobin simultaneously with the same fecal samples within 10 minutes. The values of the Fcal-LATIA closely correlated with those of the Fcal-ELISA (Spearman rank correlation coefficient, r=0.84; P<0.0001). The values of Fcal for each assay and the FIT all significantly correlated with the MESs (Spearman rank correlation coefficient, Fcal-LATIA: r=0.58, Fcal-ELISA: r=0.55, and FIT: r=0.72). The mucosal healing predictability (determined by an MES of 0 alone) of the Fcal-LATIA, Fcal-ELISA, and FIT-LATIA with the cutoffs determined by receiver operating characteristic curve analysis was 0.79, 0.78, and 0.92 for sensitivity, respectively, and 0.78, 0.69, and 0.73 for specificity, respectively.
Conclusions
The performance of the novel Fcal-LATIA was equivalent to that of the conventional Fcal assay. Simultaneous measurements with FITs would promote the clinical relevance of fecal biomarkers in UC.
INTRODUCTION
Ulcerative colitis (UC) is an idiopathic chronic inflammatory disorder that is characterized by manifestations such as diarrhea, rectal bleeding, abdominal pain, fever, anemia, and loss of body weight [1]. Several etiologies of this disease have been identified, but a complete cure is still difficult to achieve. Therefore, a precise evaluation of disease activity is important for achieving better disease control. Recently, endoscopic findings of the colonic mucosa have become essential in the evaluation of disease activity. The achievement of mucosal healing (MH) has been recommended as the goal for UC treatment, because it is associated with a reduced risk of relapse and colectomy [2]. However, a major disadvantage of using the mucosal status to evaluate disease activity is that it necessitates colonoscopy, which is an invasive and costly procedure. Thus, surrogate markers that allow for the evaluation of the mucosal status have been sought after.
Among several candidate markers, fecal calprotectin (Fcal) has become the front-runner, particularly in Western countries [3,4]. Nevertheless, we have previously reported that a quantitative fecal immunochemical test (FIT) could predict the mucosal status of UC to the same extent as or better than measuring Fcal levels [5]. Additionally, both fecal markers can predict the risk of relapse in quiescent UC patients [6]. The cost and time benefits of FITs are superior to those of Fcal tests, while Fcal has been well-established for detecting changes in the mucosal inflammation of UC patients [7]. Although it is desirable to weigh the 2 markers more precisely in terms of performance to estimate the mucosal status of UC, there are few assays that can measure both markers easily using a single sample.
The latex agglutination turbidimetric immunoassay (LATIA) detects the amount of aggregation formed with latexlinked antibodies [8]. Antigens are quantified by detecting the decrease in transmitted light via changes in absorbance (turbidity). FITs using the LATIA have the advantage of rapid and high-throughput quantifications of hemoglobin in fecal samples with automated equipment [9]. Moreover, the costs of LATIAs are lower than those of other methods, including ELISA. Therefore, this method has been used to screen for colorectal neoplasia in many countries [10-12]. Recently, we have developed a breakthrough assay that is able to measure levels of hemoglobin and calprotectin simultaneously using a single sampling probe with the LATIA system. The aim of the present study was to evaluate the performance of the novel Fcal assay (Fcal-LATIA) in predicting activity and MH of UC.
METHODS
1. Patients and Fecal Sampling
From March 2015 to September 2016, UC patients who were scheduled to undergo colonoscopy at the Okayama University Hospital were consecutively enrolled and requested to bring fecal samples for the measurement of Fcal and hemoglobin. All of the patients had an established diagnosis of UC according to endoscopic and histologic assessments and had received adequate medical therapy.
Each patient prepared 2 fecal samples with 1 defecation; 1 prepared in an OC-Auto sampling bottle 3 (Eiken Chemical, Tokyo, Japan) (Fig. 1A), and the other prepared in a TE-011 sampling bottle (Sato Kasei Kogyosho Co. Ltd., Tochigi, Japan) (Fig. 1B). The former contained a special stabilizing buffer for the examination of the FIT and Fcal with the LATIA system, while the latter was an empty polypropylene tube with a spoonshaped probe. The patients traced or inserted the probe of the OC-Auto sampling bottle 3 at several different areas of the feces and then firmly placed it back into the tube to seal it. The patients also collected a specimen of feces using the TE-011 sampling bottle. Fecal samples were collected within 2 days before colonoscopy and stored at room temperature until the day of colonoscopy. After submission, fecal samples for the LATIA analysis were stored at 4°C and examined within 3 weeks, because the fecal samples stored in the specific stabilizing buffer are stable for at least 3 days at room temperature and 3 weeks at 4°C (Supplementary Fig. 1) [13-15]. Fecal samples for the ELISA analysis were stored at −70°C until they were shipped to a laboratory and were analyzed after approximately 40 samples were collected. The measurement of FITs and Fcal were performed at the Biochemical Research Laboratory-I, Eiken Chemical Co., Ltd.
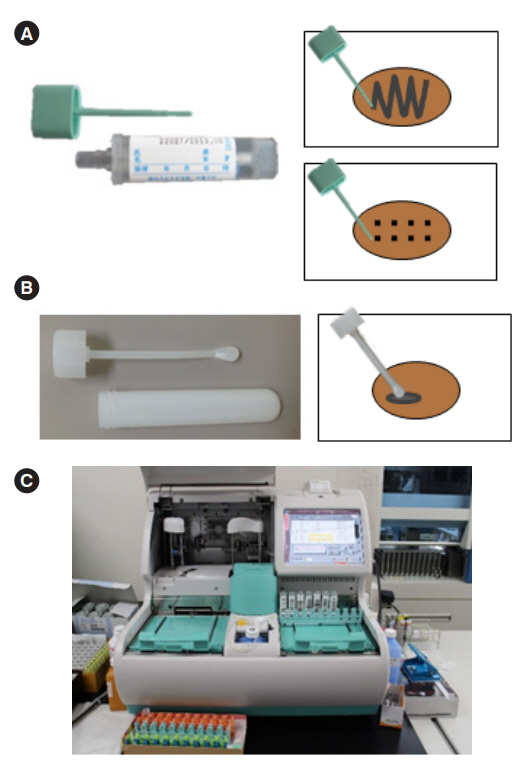
Fecal sampling bottles and OC-Sensor DIANA. (A) OC-Auto sampling bottle 3: the probe could be inserted or traced into difference areas of faces. (B) TE-011 sampling bottle: the probe could be collected a piece of feces but not thoroughly. (C) OCSensor DIANA.
2. Measurement of Fcal and FITs
Fcal levels and FITs were simultaneously measured by means of the LATIA system for the fecal samples collected using the OC-Auto sampling bottle 3. The measurements were automatically performed within 10 minutes after placing the sample bottles on the OC-Sensor DIANA (Eiken Chemical) (Fig. 1C) [9]. Using this instrument, the Fcal levels were measured as follows: an aliquot of 20 μL of the fecal sample-containing buffer was pipetted into a cuvette and after approximately 15 seconds, 100 μL of polystyrene latex particles coated with anticalprotectin mouse monoclonal antibodies and 100 μL of reaction buffer were added. The absorbance of the samples at 660 nm was measured after 30 and 390 seconds of incubation at 37°C and the changes in absorbance were calculated. The concentration of Fcal in the sample was determined on the basis of a calibration curve generated with a calprotectin calibrator. The measurement of FITs using the OC-Sensor DIANA has been reported previously [5-7,16,17]. This system can accurately measure fecal hemoglobin at concentrations of 50–1,000 ng/mL, and Fcal at concentrations of 20–2,000 μg/g. Fecal specimens with a hemoglobin concentration of >1,000 ng/mL or Fcal concentration of >2,000 μg/g were measured following dilution. Since the measurement results of small amounts of Fcal ( <20 μg/g) and fecal hemoglobin (<50 ng/mL) may not be accurately measured in this system, the concentration values below the reliable ranges were regarded as the ranges’ minimum value (e.g., 20 μg/g for Fcal-LATIA or 50 ng/mL for FIT) in data handling.
Fcal levels were also determined with a conventional ELISA using the fecal samples collected from the TE-011 sampling bottle. The measurement was performed with a commercially available ELISA kit, the Phical® Calprotectin ELISA kit (Immundiagnostik, Germany) according to the manufacturer’s instructions. The quantitative range of calprotectin was between 0.65 μg/g and 84,000 μg/g after the appropriate dilution of the fecal samples, ranging from 1:50 to 1:100,000 dilutions. The measurement with the ELISA generally took more than 2 hours.
3. Endoscopic Assessment
Colonoscopies were performed after adequate bowel preparation, and observation until the caecum was achieved in all the patients. The mucosal status of UC patients was initially assessed by each endoscopist, via the Mayo endoscopic subscore (MES) classification [18], which ranges from a score of 0 to 3 (severely active inflammation). In addition, stored still images were evaluated by at least 2 of the authors. A final consensus was achieved following a discussion between the evaluators and endoscopists. MES evaluations were performed at each portion of the colorectum (caecum and ascending colon combined, transverse colon, descending colon, sigmoid colon, and rectum), and the maximum values of the MESs were utilized for analysis. MH was defined as an MES 0 alone or an MES of 0 or 1 throughout the colorectum. Endoscopists and evaluators were all blinded to the results of the fecal tests.
4. Statistical Analysis
Correlations between variables, including MESs, FITs, and Fcal, were estimated with Spearman rank order correlation coefficient. Receiver operating characteristic curves (ROC) were used to assess the best cutoff value for detecting MH. Sensitivity, specificity, positive predictive values (PPV), and negative predictive values (NPV) with a 95% CI for detecting MH were determined based on the Fcal and FIT results. All statistical analyses were performed using JMP pro version 12 software (SAS Institute, Cary, NC, USA). All P-values were 2-sided and considered statistically significant when less than 0.05.
5. Ethical Considerations
All patients gave written informed consent to participate in this study. This study protocol conforms to the ethical guidelines of the 1975 Declaration of Helsinki and was approved by the Institutional Review Board of the Okayama University Graduate School of Medicine, Dentistry, and Pharmaceutical Sciences on February 24, 2015. Eiken Chemical provided the sampling tubes and covered the costs of the measurement of Fcal and FITs.
RESULTS
1. Patient Characteristics
In total, 152 UC patients were enrolled (77 males [51%]; median age, 44 years [range, 14–78 years]; 101 [66%] had pancolitis, 35 [23%] had left-side colitis, and 16 [11%] had proctitis; 113 [74%] were in clinical remission and 39 [26%] were in the clinically active stage of the disease) and submitted fecal samples for the measurement of Fcal and FITs. The median values of the Fcal-LATIA, Fcal-ELISA, and FIT results were 215 μg/g, 155 μg/g, and 50 ng/mL, respectively (Table 1).

Characteristics of the Study Patients
2. Correlations between Colonoscopic Findings and Fcal-LATIA and Fcal-ELISA Results
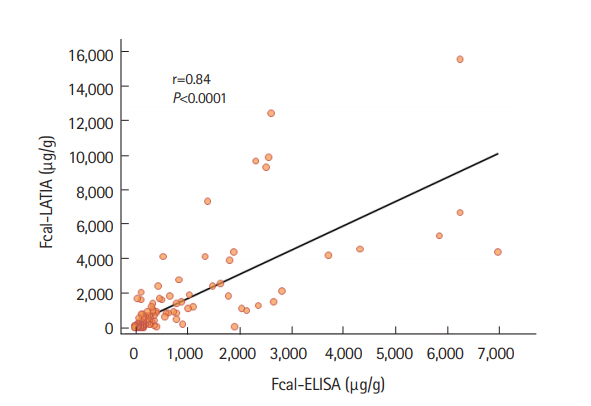
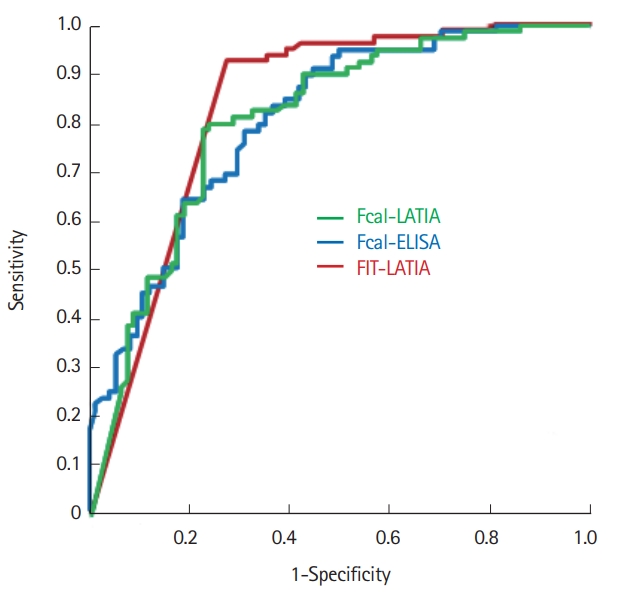
The values of the assay results were evaluated in comparison with each other and in conjunction with the colonoscopic findings. Each fecal marker significantly correlated with the colonoscopic findings evaluated with MESs (Spearman rank correlation coefficient: Fcal-LATIA, r =0.58, P<0.0001; Fcal-ELISA, r =0.55, P<0.0001; and FIT, r =0.72, P<0.0001) (Fig. 2). A significantly stronger correlation was observed between the Fcal-LATIA values and those of the Fcal-ELISA (Spearman rank correlation coefficient: r=0.84, P<0.0001) (Fig. 3).
Correlations between fecal markers and colonoscopic findings (maximum MES in the colorectum). The results of the Fcal-LATIA (A), Fecal-ELISA (B), and FIT (C) were significantly correlated with the maximum MES (r=0.58, P<0.0001; r=0.55, P<0.0001; and r=0.72, P<0.0001; respectively). MES, Mayo endoscopic subscore; Fcal, fecal calprotectin; LATIA, latex agglutination turbidimetric immunoassay; FIT, fecal immunochemical test.
Correlations between Fcal-LATIA and Fcal-ELISA results. A significantly close correlation was observed between the Fcal-LATIA and Fcal-ELISA test results (r=0.84, P<0.0001). Y=1.40X+225.6, R2=0.54. Fcal, fecal calprotectin; LATIA, latex agglutination turbidimetric immunoassay.
3. Sensitivity, Specificity, and Predictive Values of Fcal-LATIA, Fcal-ELISA, and FIT-LATIA for Mucosal Healing
The predictability of MH, which was defined as an MES of 0 alone or an MES of 0 or 1, was determined using the abovementioned fecal markers. When MH was defined as an MES of 0, the ROC analysis showed similar AUCs for the Fcal-LATIA, Fcal-ELISA, and FIT (0.82, 0.80, and 0.83, respectively) (Fig. 4). The predictability using the cutoffs determined by the ROC analysis (224 μg/g for Fcal-LATIA, 184 μg/g for Fcal-ELISA, and 50 ng/mL for FIT) revealed a sensitivity of 0.79, 0.78, and 0.92, respectively, and specificity of 0.78, 0.69, and 0.73, respectively (Table 2).
Receiver operating characteristic curves of Fcal-LATIA, Fcal-ELISA, and FIT-LATIA for predicting mucosal healing. The receiver operating characteristic curves analysis for predicting mucosal healing showed similar AUCs between the Fcal-LATIA, Fcal-ELISA, and FIT (0.82, 0.80, and 0.83, respectively). Fcal, fecal calprotectin; LATIA, latex agglutination turbidimetric immunoassay; FIT, fecal immunochemical test; AUC, area under the curve.

Sensitivity, Specificity, and Predictive Values of Fecal Biomarkers for Mucosal Healing (MES0) with Optimal Cutoffs (by ROC Analysis)
When MH was defined as an MES of 1, the ROC analysis showed similar AUCs between the Fcal-LATIA, Fcal-ELISA, and FIT (0.80, 0.78, and 0.90, respectively). The predictability using the cutoffs determined by the ROC analysis (251 μg/g for Fcal-LATIA, 204 μg/g for Fcal-ELISA, and 78 ng/mL for FIT) revealed a sensitivity of 0.63, 0.66, and 0.79, respectively, and specificity of 0.92, 0.85 and 0.96, respectively (Table 3).
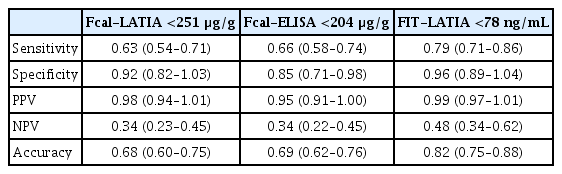
Sensitivity, Specificity, and Predictive Values of Fecal Biomarkers for Former Mucosal Healing (MES0 and MES1) with Optimal Cutoffs (by ROC Analysis)
These results suggest that the performance of the Fcal-LATIA was equivalent to that of the Fcal-ELISA in evaluating UC activity and that the sensitivity of FIT for MH was slightly higher than either Fcal test.
DISCUSSION
Although Fcal is an effective biomarker for IBD, long times for measurements and high costs have been critical problems limiting its clinical use. A novel Fcal assay using the LATIA system can quantify Fcal within 10 minutes, and the values of the Fcal-LATIA were significantly correlated with endoscopic activity in our study, including MH. In addition, the values with the new assay system closely correlated with those of a conventional Fcal assay using an ELISA. Moreover, it is noteworthy that the new system enabled the simultaneous measurement of Fcal and FITs, which would allow for the more precise prediction of the mucosal status and risk of relapse in UC patients.
The LATIA system was developed based on the antigen-antibody immune response, and has been utilized for determining clinical values of CRP [19], fibrinogen [20], and Helicobacter pylori antibodies [21] in laboratories and hospitals. The system measures the aggregation of antigens and latex-linked antibodies. Antigens are quantified by detecting the decrease in transmitted light indicated as changes in absorbance (turbidity). The principle of the LATIA is simple, and there are several advantages to this assay system including rapidity, low costs, and no requirements for specialized equipment. At present, the cost of an Fcal-LATIA cannot be determined precisely because the kit is not yet commercially available. However, the system does not differ largely from FITs because the difference is only the addition of another kind of antibody. The cost of an FIT is $10, whereas that of an Fcal-ELISA is $30. Therefore, the cost of an Fcal-LATIA is expected to be lower than that of an Fcal-ELISA.
For the measurement of fecal samples using the LATIA system, the specially designed sampling bottles showed 3 advantages. Firstly, the collection of feces was easier than with the TE-011 sampling bottle. The specially designed bottle’s probe could be inserted or traced at different areas of feces, and these collection methods may minimize the biases caused by sample collection. In addition, the difference in fecal sampling might affect the commonly high values and high cutoffs associated with Fcal-LATIA because collection from a wide area of feces is likely to reflect the condition of the entire colorectum. Secondly, the bottle can be directly inserted into the dedicated automated equipment. Technicians need not open the bottle, keeping their hands clean, and, moreover, the time required for measurement is reduced. Finally, the fecal sample with the dedicated stabilizing buffer is stable for a few days at room temperature and more than 3 weeks in the refrigerator (4°C) [13-15]. This stability is convenient for patients submitting samples. Due to these advantages, FITs based on the LATIA system have been used to screen for colorectal neoplasia, not only in Japan, but also in Western countries in place of guaiac-based fecal occult blood tests. This system, however, has not been able to measure calprotectin concentrations due to the lack of adequate latex-linked antibodies. Herein, we described the development of a specific calprotectin antibody and measured calprotectin concentrations in feces with this system, to demonstrate the suitability of the results for clinical use.
Fcal, a calcium-binding heterodimer that is abundant in the cytoplasm of neutrophils, is the most widely used surrogate marker of mucosal inflammation. According to a recent review, Fcal has shown the ability to predict the presence of active inflammation in UC patients with a sensitivity of 0.88 (95% CI, 0.84–0.92) and specificity of 0.79 (95% CI, 0.68–0.87) with cutoffs ranging from 48 to 280 μg/g [22]. This fecal protein has also been used as a marker for MH, and the sensitivity and specificity for predicting MH have been reported to be 0.54–0.91, and 0.72–0.85, respectively [5,23,24].
On the other hand, FITs have enabled the quantification of fecal hemoglobin concentrations using an antibody specific to human hemoglobin, and has proven to be an effective non-invasive test for screening colorectal neoplasia [11]. Ours is the first report on the usefulness of FITs in clinical practice for UC, and FITs can predict MH (MES 0) with a 92% to 95% sensitivity and 62% to 71% specificity; the values of the present study are in line with our previous findings [5,6,7,16].
There appear to be benefits to the simultaneous measurement of Fcal and FITs in clinical practice for UC. Biomarkers for IBDs are mainly used clinically for the following purposes: monitoring disease activity, the prediction of MH, and the prediction of the risk of relapses. We previously reported that FITs are superior in predicting MH, while Fcal is advantageous for monitoring endoscopic activity [7]. Therefore, the simultaneous measurement of these 2 markers may compensate for each other’s shortcomings, and allow for the more precise prediction of disease activity and MH.
More importantly, the simultaneous measurement of the 2 markers may predict the risk of relapse in quiescent UC patients more effectively. As our previous reports have indicated, the categorization of patients into 3 groups according to fecal marker status (FIT-positive, FIT-negative and Fcal-positive, or both-negative) can efficiently stratify the risk of relapse into graded increases of risk (FIT-negative and Fcal-positive: HR, 2.05; 95% CI, 1.02–4.43; P=0.0045, and FIT-positive: HR, 5.43; 95% CI, 2.57–11.76; P<0.0001, compared to both-negative) [17]. In the future, improvement of the clinical course of UC using the simultaneous measurement of both fecal markers should be verified.
In terms of the usefulness in clinical practice, the rapidity of the LATIA is a great advantage, because the evaluation of disease status and decision of treatment modification could be performed in 1 clinic/hospital visit without delay. In particular, the prediction of the risk of relapse might be invalid in situations with longer times for laboratory assay as in ELISA, because the results of fecal tests cannot be incorporated in clinical practice on the day of feces submission, and any delay could interfere with the early detection of the signs of relapse. In this context, the LATIA’s rapid measuring system would greatly influence the clinical practice of UC treatment, and many patients would benefit from an expectation of a better clinical course.
The results of several Fcal assays other than ELISA have been reported, including methods using colloidal gold particles [25,26], immunochromatography [27-30], and an enzyme fluoroimmunoassay [27]. The correlation coefficients between these methods and a conventional ELISA for Fcal were 0.65 to 0.98, and the performance of these methods, with the exception of a fluoroimmunoassay, was sufficiently similar to that of an ELISA. For these comparison studies, it should be noted that higher correlations were observed when comparing fecal samples from the same sample tubes than when comparing separately collected samples from different tubes (correlation coefficients: 0.82–0.98 vs. 0.75–0.91, respectively) [25-30]. This suggests that the variations in the measurements of Fcal levels could be more attributable to biases due to sampling than due to assay methods. In this study, the sample tubes for the Fcal-LATIA were different from those for the Fcal-ELISA. Nonetheless, the correlations between values from different sample tubes were sufficiently high (correlation coefficient: 0.84), indicating that the LATIA methods are reliable and merit clinical application. In this context, we verified the correlations between the Fcal-LATIA and Fcal-ELISA using samples taken from the same sampling bottles (OC-Auto sampling bottle 3), with the results producing a higher correlation coefficient (0.95) than that of samples from different sampling bottles (Supplementary Fig. 2), although the results of the ELISA tests with these samples were not validated.
There are limitations to this study. Firstly, the number of patients in the remission stage was relatively large. Validation studies with cohorts incorporating larger numbers of patients in the active disease stage are required. Secondly, as indicated above, the different sampling methods for feces required for the LATIA and ELISA tests probably affected the results.
In conclusion, Fcal measured with the novel LATIA system showed equivalent performance to a conventional ELISA system in terms of monitoring endoscopic activity and the prediction of MH in UC patients. Moreover, this new system enabled the simultaneous measurement of Fcal and FITs with one-time sampling. The clinical course of UC may be improved using this novel assay system for patient fecal samples. Future studies should verify the impact of simultaneous measurements on the clinical practice of IBD.
Notes
FINANCIAL SUPPORT
Eiken Chemical Co., Ltd. (Tochigi, Japan) provided the sampling tubes and the cost of Fcal and FIT analyses.
CONFLICT OF INTEREST
No potential conflict of interest relevant to this article was reported.
AUTHOR CONTRIBUTION
Guarantor of the article: Hiraoka S. Design and conduct of clinical trials and contribution of data: Hiraoka S, Seki Y, Watanabe K. Data collection and analysis: Takashima S, Inokuchi T, Takahara M, Harada K, Okada H. Statistical analysis: Nakarai A. Study supervision: Kato J, Okada H. All authors provided critical review of content and final approval of the manuscript.
Acknowledgements
The authors are grateful to Mayumi Tokumitsu for research assistance for this study.
SUPPLEMENTARY MATERIALS
Supplementary Fig. 1. The percentage of calprotectin recovery compared with the baseline over time at different temperatures (n=15). (A) The residual calprotectin recovery of specimens preserved in special buffer at 4°C for 21 days was 81% to 115%, average 97.3%, exceeding 80%. (B) The residual calprotectin recovery of specimens preserved in special buffer at 25°C for 3 days was 74% to 116%, average 95.0%, exceeding 80%.
Supplementary Fig. 2. The correlation between Fcal-LATIA and Fcal-ELISA (measured using the same sample from an OC-Auto sampling bottle). Y=1.27x+30.6, R2=0.69. Fcal, fecal calprotectin; LATIA, latex agglutination turbidimetric immunoassay.