


INTRODUCTION
Inflammatory bowel diseases (IBD), consisting of CD and UC, are chronic inflammatory disorders of the GI tract. Complex interactions between environmental, genetic and immunological factors are thought to underlie the disease development, leading to a dysregulated immune response to intestinal microbiota [1]. Over the past few decades, IBD has become more prevalent in Asia [2]. In Singapore, close to 2,000 patients suffer from IBD [3].
Chronic nature of the disease, frequent recurrence of debilitating GI symptoms, extraintestinal manifestations (EIMs), the effects of medical treatments and the associated side effects, worries about developing cancer and the need for surgical interventions as well as hospitalizations place substantial burden on the daily lives of IBD patients and cause significant impairment in their health-related quality of life (HRQoL) [4-7].
HRQoL is defined as a multi-dimensional concept that incorporates the physical, social and emotional features of health perception and health functioning [8,9]. Assessment of HRQoL is increasingly becoming an important aspect of medical decision-making, as improving HRQoL is a major goal of therapy and value-based healthcare [10]. In IBD, poorer HRQoL have been reported compared to the general population [11,12]. Therefore, evaluating and improving their HRQoL are as important as controlling the disease activity.
Numerous clinical and demographic factors have consistently been identified to be associated with poorer HRQoL. These factors include disease activity, symptom severity, number of relapses, surgical procedures and work absenteeism [7,13,14]. However, conflicting data exists across studies from different countries or population types for other factors such as disease duration, IBD treatments, age, gender, educational and smoking status [13-17].
As majority of the HRQoL studies were conducted in Western countries, their findings may not be representative of the IBD population in Singapore due to cultural differences and different coping strategies [18,19]. This is evident in 2 China studies which have acknowledged that the differences in clinical characteristics of IBD in the Chinese population, as well as cross-cultural and behavioral differences, could have led to deviations in their findings when compared to that of the Western population [13,20]. Furthermore, the HRQoL of IBD patients in Singapore has not been sufficiently investigated.
Therefore, the aim of this study is to assess and compare the HRQoL of IBD patients in Singapore, and to identify the sociodemographic and clinical factors influencing their HRQoL. Knowledge of the HRQoL of IBD patients and its associated factors will provide a better understanding of patientsā global situation and aid in provision of more personalized care.
METHODS
1. Study Design and Ethical Considerations
We conducted a prospective, cross-sectional study involving patients with IBD recruited from the outpatient IBD Centre at Singapore General Hospital between August 2016 and September 2017. Patients aged ā„21 years with an established IBD diagnosis, on IBD medication therapy and ability to read and comprehend English, and ability to provide informed consent were included. Non-Singaporeans and patients with neuropsychiatric conditions which may impair their ability to respond to the HRQoL evaluation were excluded. The study was approved by the SingHealth Centralized Institutional Review Board (CIRB No. 2016/2636). Informed consent was obtained from each patient in the study. The study protocol conforms to the ethical guidelines of the 1975 Declaration of Helsinki (6th revision, 2008) as reflected in a priori approval by the institutionās human research committee.
2. Study Procedure
Patients with IBD were approached as they awaited consultation with a gastroenterologist. A set of self-administered or interviewer-administered questionnaires on HRQoL and disease activity were given to patients following consent taking. Patientsā demographic information, details on medication use and adherence, clinical diagnosis and disease characteristics were obtained from both the questionnaires and electronic medical records.
3. Demographics and Disease Characteristics
Demographic variables obtained were age, gender, race, education, employment, monthly income, housing, marital status and smoking status. Patientsā disease characteristics obtained were their diagnosis (UC or CD), disease duration, disease location and behavior, presence of perianal disease or EIMs, laboratory results (CRP and fecal calprotectin [FC] concentrations), number of hospitalizations and surgical procedures over the past 1 year, and Charlson Comorbidity Index (CCI) [21].
The types of common treatment modalities identified were 5-aminosalicylic acid (5-ASA), immunomodulators, corticosteroids and biologics. Patientsā adherence was assessed using the Medication Adherence Report Scale (MARS-5). The MARS-5 consists of 5 common patterns of medication non-adherence behavior. Scores on a 5-point Likert scale were summed, ranging from 5 to 25. A score of ā„20 was considered adherent [22].
4. Measurements of HRQoL
Patientsā HRQoL was measured using the short IBD questionnaire (SIBDQ), Short Form-36 Health Survey (SF-36) and EuroQol 5-dimensions 3-levels (EQ-5D-3L). The minimum clinically important difference (MCID) of the respective instruments was used to assess the clinical significance, given a statistically significant result. MCID represents the smallest difference in scores that is considered to be clinically significant and is selected based on literature review.
1) Short IBD Questionnaire
The SIBDQ is a 10-item disease-specific questionnaire, which measures 4 domains of HRQoL, comprising social performance, emotional status, bowel function and systemic symptoms [23]. Scores from individual domains are summed to obtain a total score ranging from 10 to 70, which correspond to poor-to-good HRQoL respectively. The selected MCID of the SIBDQ is 10 points [23]. The SIBDQ has been validated in IBD populations [24].
2) Short Form-36 Health Survey
The SF-36 survey is the most widely used generic profile-based HRQoL instrument in research [11,25]. It consists of 36-item questions that are categorized into 8 domains (physical functioning, role limitations due to physical health problems, bodily pain, social functioning, role limitations due to emotional problems, general mental health, vitality or energy level, and general health perceptions) [25]. It can generate 2 summary scores: physical component summary (PCS) and mental component summary (MCS). Higher scores indicate better physical and mental health respectively. The MCID of SF-36 is 5 points [26]. Population norms are available for Singaporeās general population [27,28].
3) EuroQol 5-Dimensions
The EQ-5D is a generic preference-based questionnaire validated for the assessment of HRQoL in the IBD patient populations and Singapore population [29-31]. It covers 5 dimensions: mobility, self-care, usual activity, pain and discomfort and anxiety/depression. Patients are required to rate each dimension on 3 levels, reflecting no problem, some problem and extreme problem [32]. The dimensional scores are subsequently used to derive a utility score. The questionnaire also includes a 20 cm visual analogue scale (VAS) that allows patients to rate their state of health by drawing a line from an anchor box to the point on the VAS which best represents their health on that present day. The MCID of EQ-5D utility score and VAS are 0.08 and 10 points respectively [26,29].
5. Measurements of Disease Activity
The CRP levels in blood samples were used as an objective marker of inflammation, and values >9.1 mg/L were considered elevated. FC concentrations were also used to determine disease activity, and an elevated FC level was defined as >200 Ī¼g/g.
Disease activity were assessed using the Partial Mayo index (PMI) for UC and Harvey-Bradshaw Index (HBI) for CD [33,34]. These 2 indices are chosen because they are widely used in clinical trials, non-invasive and rely entirely on symptoms of the patient. A PMI score of ā¤1 indicates remission, 2-4 indicates mild disease, 5-6 indicates moderate disease and 7-9 indicates severe disease whereas an HBI score of <5 indicates remission, 5-7 indicates mild disease, 8-16 indicates moderate disease and score >16 indicates severe disease [33,34]. The disease activity was further dichotomized into remission or active disease in the data analysis.
6. Statistical Analysis
Statistical analyses were performed using IBM SPSS version 24 (IBM Corp., Armonk, NY, USA). Descriptive statistics were used to summarize patient demographics and clinical characteristics. Continuous variables were presented as mean and SD, while categorical variables were presented as frequency and percentage.
The HRQoL data were presented as dimensional and total scores for SIBDQ, dimensional and component summary scores for SF-36, utility scores for EQ-5D and total scores for EQ-VAS. Chi-square test, independent samples t-test and Mann-Whitney test were conducted for categorical, normal and skewed continuous variables respectively. As UC and CD patients had similar HRQoL scores, patient data from both groups were pooled together for subsequent analyses.
Multiple linear regression was used to identify variables that are associated with the HRQoL of IBD patients. The respective HRQoL scores were used as dependent variables. The following demographic and clinical variables were included as covariates: age, gender (female/male), race (Chinese/non-Chinese), education (tertiary/non-tertiary), employment status (employed/non-employed), monthly income status (high [ ā„$3000] vs. low [ <$3000]), housing (public/private), marital status (married/others), smoking status (smoker/former and non-smoker), Charlson Comorbidity Index, disease duration, disease severity (active/remission), use of 5-ASA, immunomodulators, corticosteroids and biologics, medication adherence (high [MARS ā„20] vs. low [MARS <20]), EIMs and number of IBD-related hospital admissions in the past year. These variables were selected based on literature reviews and clinical experience [7,13-17]. A P-value of <0.05 was considered to be statistically significant.
RESULTS
1. Demographics and Clinical Characteristics
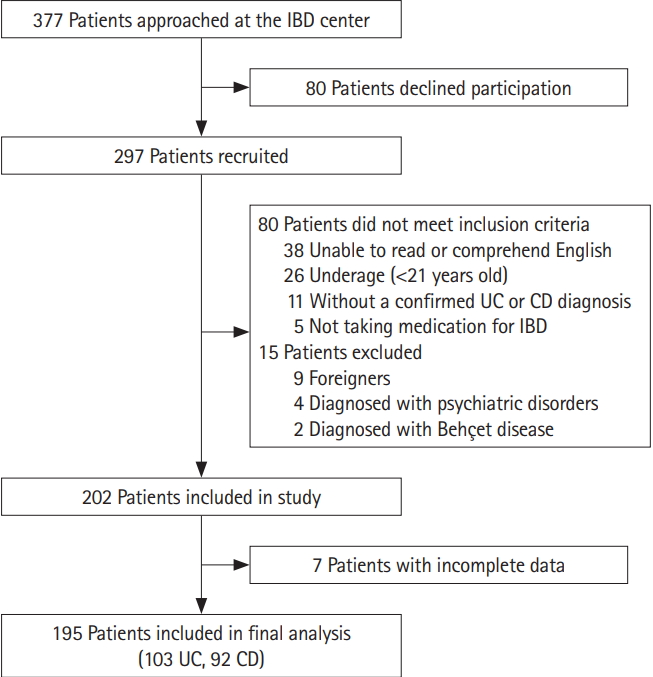
A total of 377 IBD patients were approached at the Singapore General Hospital IBD Centre for participation in the study. The final study population consisted of 195 patients (103 UC, 92 CD) (Fig. 1). The baseline demographics and clinical characteristics of patients included in the analyses are presented in Table 1. Patients with CD were significantly younger (meanĀ±SD, 42.3 Ā±15.8 vs. 51.4 Ā± 13.6, P<0.001), mostly not married (60.9% vs. 77.7%, P=0.016) and with a lower CCI (0.32 Ā±0.66 vs. 0.18 Ā±0.71, P=0.007) than UC patients. No significant difference was observed when comparing other socio-demographic parameters between groups.
Patients diagnosed with UC had a longer disease duration than those diagnosed with CD (meanĀ±SD, 12.6 Ā±9.6 vs. 9.6 Ā±8.0, P=0.018). The majority of our participants were in disease remission (73.8%), with a significantly greater percentage of CD patients in disease remission (83.7% vs. 65.1%, P=0.012) compared with UC. The proportion of patients with FC >200 Ī¼g/g was higher in the CD group (47.8% vs. 29.1%, P=0.036) than in the UC group. The choices of treatment options for the 2 groups were also significantly different. Amino-salicylates were used in a greater majority of UC patients, as compared to CD patients (97% vs. 50%, P<0.001). By contrast, the use of immunosuppressants and biologics were more common in the CD group than in the UC group (73.9% vs. 23.3%, P<0.001 and 40.2% vs. 6.8%, P<0.001).
2. HRQoL Scores in Patients with IBD
The scores of the various HRQoL instruments are summarized in Table 2. The meanĀ±SD SIBDQ score was 55.7 Ā±10.4 while the meanĀ±SD SF-36 PCS and MCS were 74.1 Ā±19.2 and 73.4 Ā±19.0 respectively. Patients had a mean Ā±SD health utility of 0.838Ā±0.223 based on EQ-5D-3L and a meanĀ±SD VAS of 71.2 Ā±16.5. There were no significant differences in any of these HRQoL scores between UC and CD patients.
3. Factors Associated with HRQoL
In the multivariate analysis, presence of active disease (b=ā6.293 [SIBDQ], ā9.409 [PCS], ā9.743 [MCS], ā7.254 VAS]), use of corticosteroids (b=ā7.392 [SIBDQ], ā10.390 [PCS], ā8.827 [MCS]) and poor medication adherence (b=ā4.049 [SIBDQ], ā1.320 [MCS], ā8.961 [VAS]) were significantly associated with lower HRQoL across all 3 instruments (Table 3). In particular, the HRQoL of the IBD patients based on their disease activity is shown in Table 4.
Presence of EIMs or comorbidities were associated with a significant decrease in patientsā SF-36 PCS (b=ā13.381 and ā4.531 respectively). Employment (b=9.738 [MCS], 0.104 [EQ-5D-3L]) and public housing (b=ā8.070 [PCS], ā9.207 [VAS]) were socio-demographic factors that had significant influence on patientsā generic HRQoL. Age (b=0.281 [MCS], ā0.272 [VAS]) had a statistically significant impact on HRQoL but the magnitude was not clinically significant.
Other factors were associated with a clinically significant difference in patientsā HRQoL. The use of immunomodulators or biologics resulted in a decrease in MCS (b=ā5.535 and ā5.094, respectively) with a magnitude greater than the MCID, while smokers had a better PCS (b=6.809) as compared to non-smokers or former smokers. However, these results were not statistically significant (P>0.05).
DISCUSSION
The importance of assessing the HRQoL of patients with IBD is increasingly acknowledged in research and clinical care. It complements the conventional measures of disease activity, providing better insight into the overall impact of IBD on patientsā lives and their unmet needs, thereby contribute to an improved patient care [35]. While many studies examining the HRQoL of IBD patients and its associated factors have been conducted across various countries, this remains under-studied in Singapore. To the best of our knowledge, this is the first prospective study to measure the HRQoL of multi-ethnic Singaporean IBD patients. In this study, we used 3 different disease-specific and generic HRQoL instruments (SIBDQ, SF-36 and EQ-5D-3L) to holistically assess patientsā HRQoL.
The results of our study demonstrated that IBD patients had a reduced HRQoL. The mean SF-36 PCS and MCS as well as EQ-5D-3L scores of our study population were lower than the Singapore population norms [27,30]. The difference in SF-36 scores from population norms ranged from 6.1 to 11.7, and was substantially greater than the MCID for SF-36, especially in the dimensions of physical role limitations, general health and vitality (Supplementary Table 1). Likewise, the difference in mean EQ-5D utility scores from population norms (ā0.12) exceeded the defined MCID. These results are consistent with those of other studies across different countries [11,12]. The mean total SIBDQ score obtained in our study was similar to that of studies conducted in the United States and in Europe, which also reflected impairment in IBD patientsā HRQoL [36,37]. Therefore, it is imperative to assess their HRQoL and address the underlying causes of this impairment.
We found no significant differences between the HRQoL of UC and CD patients in this study. This indicates that disease type is not a key determinant of HRQoL in IBD patients. This result is consistent with various other studies [7,13,15,38]. Although some review articles have found that patients with CD have poorer HRQoL than those with UC [39,40], this was not evident in our study. In those studies, the difference in HRQoL was partly attributed to CD patients having a comparatively more severe disease course as well as higher incidence of surgical procedures. We postulated that as the majority of our patients were in disease remission, we were unable to pick up differences in HRQoL scores between the 2 groups.
Amongst the factors found to be associated with poorer HRQoL, disease activity has frequently been reported as a significant predictor of IBD patientsā HRQoL, regardless of the instruments used [7-9,11-16]. In our study, a strong inverse relationship existed between disease activity and HRQoL across 3 instruments. This indicates that active disease affects multiple aspects of HRQoL. High disease activity often lead to disabling symptoms, including abdominal pain, diarrhea and fatigue. These symptoms worsen during relapse, affecting patientsā daily activities and personal productivity [9,38,41]. Since disease activity has such an extensive effect on HRQoL, the use of effective treatment regimens that can effectively maintain disease remission and normalize HRQoL through resolution of symptoms are of great importance [42].
Our analysis has also shown that corticosteroids use independently resulted in a marked decrease in HRQoL. This has also been previously reported [16,20,36,41]. Corticosteroids are often given to IBD patients with an acute disease flare, characterized by a worsening of symptoms. Hence, the use of corticosteroids is a clinical factor related to disease activity, resulting in a similar decrease in HRQoL. However, additional analyses were performed to test the interaction between disease activity and corticosteroids, which was found to be not statistically significant. Therefore, the negative side-effect profiles of steroid therapy could be a more likely reason for its independent association with HRQoL, given that it adds to patientsā diseaserelated worries and concerns, leading to a poorer perception of their health status [8].
In this study, patients with poor medication adherence had lower HRQoL scores. Although this association between adherence and HRQoL is not well-studied, similar findings were observed in other adult and pediatric IBD populations but not in a Hungarian IBD population [43-45]. Despite the conflicting results, the impact of poor medication adherence is increased frequency of relapses, higher rate of complications and increased healthcare cost [46-48]. Conversely, medication adherence would reduce these risks and lead to better HRQoL. Moreover, patients who are adherent are often more proactive in taking care of their health and hence more likely to achieve better disease control. In light of this finding, further research should be conducted to better understand and address the causes of medication non-adherence in IBD patients.
Presence of EIMs and comorbidities both independently caused a significant reduction in patientsā SF-36 PCS scores. These associations were similarly reported in other IBD studies which demonstrated that IBD patients with EIMs and coexisting chronic conditions face greater disablement in their daily living due to greater symptom burden, high pill burden and a decreased sense of well-being [42,49,50].
The socio-demographic factors that were identified as independent predictors of HRQoL include employment status and housing type. Our study participants who were in full- or parttime employment and those residing in private housing had significantly higher generic HRQoL scores. This could be because patients who are working might have better financial support while patients living in private housing could be of higher socio-economic status. Hence, this group of patients could face less financial concerns [50]. Likewise, many studies have shown that patients who are not working or are unable to work have poorer HRQoL [5,13,14,43]. Since IBD patients face considerable treatment and healthcare costs, it is important to consider patientās need for financial and social support services, especially for those with work disabilities or lower socioeconomic status.
The association between age and HRQoL of IBD patients remains controversial. In certain populations, older patients had lower HRQoL scores while other studies found no significant association [11,13,15,16,38]. In our study, the associations between age and SF-36 MCS or EQ-5D VAS were statistically significant but not clinically significant. Similar to the results of a US study, younger patients had lower MCS but higher VAS when compared to older patients [36]. It is likely that younger patients are less able to cope with the chronicity of IBD, disease flares and complications, especially if they are at the prime of their adulthood. On the other hand, the lower perceived health state of older patients could be due to age-related decline, comorbidity burden, unemployment and reduction in functional independence [51,52]. To address these issues, IBD patients are encouraged to join the local IBD patient support group, in which they can relate their experiences and share advice and coping strategies. This would give them additional moral support and increased self-confidence which is needful in their journey living with IBD [53].
While our results could be useful in future efforts to improve the quality of care for patients with IBD, it is important to recognize the limitations of this study. First, laboratory tests were ordered at the discretion of the physician. As a result, there were a considerable number of patients without CRP and FC readings. Hence, we were unable to include these objective measures as explanatory variables in the analysis. Instead, we circumvented this problem through the use of established disease activity indices. Second, a majority of the patients recruited had mild disease or were in clinical remission; none of our participants had severe disease activity and a small number of patients presented with moderate disease. As such, our results might not accurately reflect the HRQoL of patients with more severe disease states. Third, as this is a cross-sectional study, our results could only reflect the association between selected factors and HRQoL but could not draw causal inferences. Nonetheless, this study adds to the current literature, providing insight into the HRQoL of patients with IBD in Singapore.
In conclusion, our study has shown that HRQoL is impaired among Singaporean patients with IBD and that the magnitude of this impairment is similar in both UC and CD patients. Clinical characteristics are better determinants of their HRQoL than socio-demographic factors. In particular, more attention should be given to IBD patients with active disease, corticosteroid use and poor medication adherence as these factors resulted in a significant reduction in HRQoL across all 3 instruments. Greater awareness of the impact of IBD on patientsā HRQoL would improve the holistic management of IBD patients.