


INTRODUCTION
Peutz-Jeghers syndrome (PJS) is an inherited polyposis syndrome in which multiple characteristic polyps occur in the gastrointestinal (GI) tract; it is associated with mucocutaneous pigmentation, especially along the vermilion border of the lips. It is inherited in an autosomal dominant manner and is caused by a germline mutation encoding the serine/threonine kinase STK11 (LKB1) gene on chromosome 19p13.3.1
The predominant clinical feature of PJS is intestinal hamartomatous polyposis. Hamartomas can develop throughout the GI tract but are mainly located in the small intestine, usually in the jejunum. They may cause abdominal pain, blood loss, or acute intestinal obstruction, often resulting from intussusception of a small bowel segment carrying a large hamartoma.2 Generally, the traditional treatment of surgical resection is difficult to apply for every PJS-related complication because repeated small bowel resection can cause unintentional complications such as short bowel syndrome.3,4 Although minimally invasive endoscopic therapy has been reported recently,5,6,7 its use is also limited for many polyps in the small bowel because of the time-dependent nature of the procedure, air over-distension, incomplete resection, and complications.
Here, we report the case of a patient with PJS who underwent combined operative and endoscopic polypectomy to eliminate any possible polyps in the GI tract and to avoid short bowel syndrome.
CASE REPORT
A 40-year-old male patient was referred to our hospital for evaluation and management of prolonged recurrent abdominal pain and intermittent hematochezia. He was diagnosed with PJS 20 years ago and had already undergone 3 small bowel resections for bowel obstruction because of small bowel intussusception. The first surgery occurred when the patient was in high school. In addition, he underwent a polypectomy for gastric and colonic polyps 17 years previously. There was no family history of this syndrome.
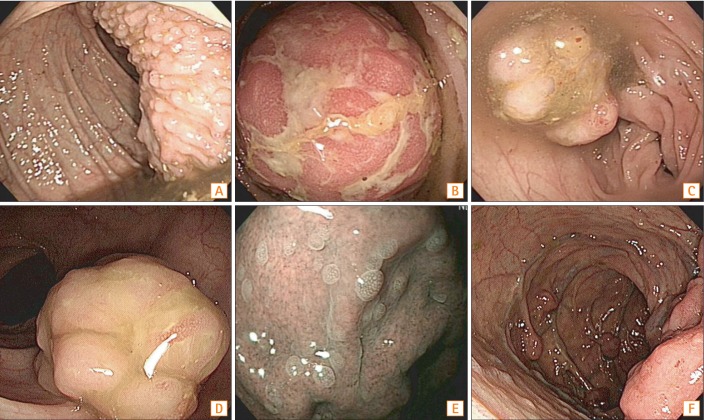
In outpatient care, upper (GIF-H260; Olympus, Tokyo, Japan) and lower endoscopic (CF-H260AI; Olympus, Tokyo, Japan) exams were performed on the same day, and polyps of the GI tract were observed. The endoscopic exam showed transient ileal telescoping to the ascending colon, an ileal mass almost blocking the lumen, multiple pedunculated colonic polyps, tiny gastric polyps, and pedunculated proximal jejunal polyps (Fig. 1). Sequential polypectomies were planned.
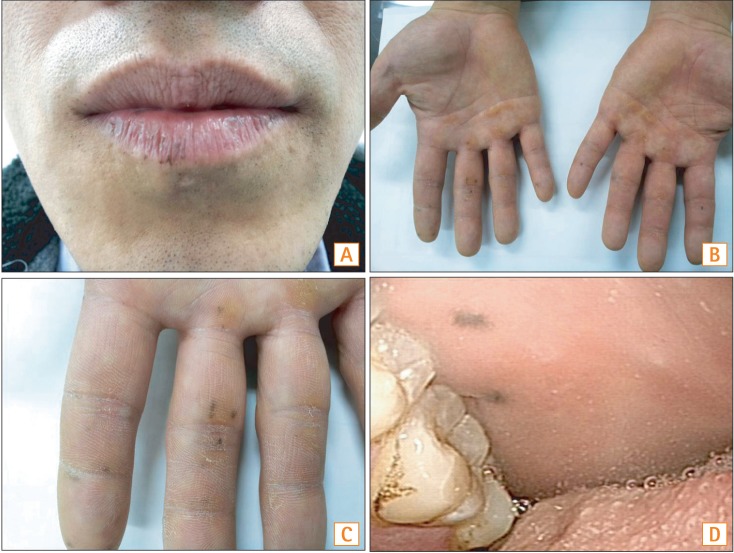
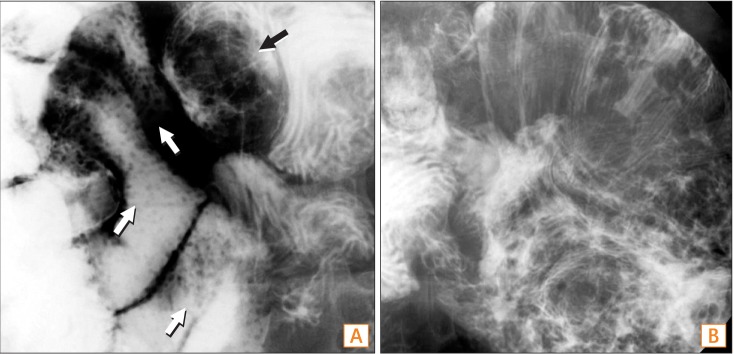
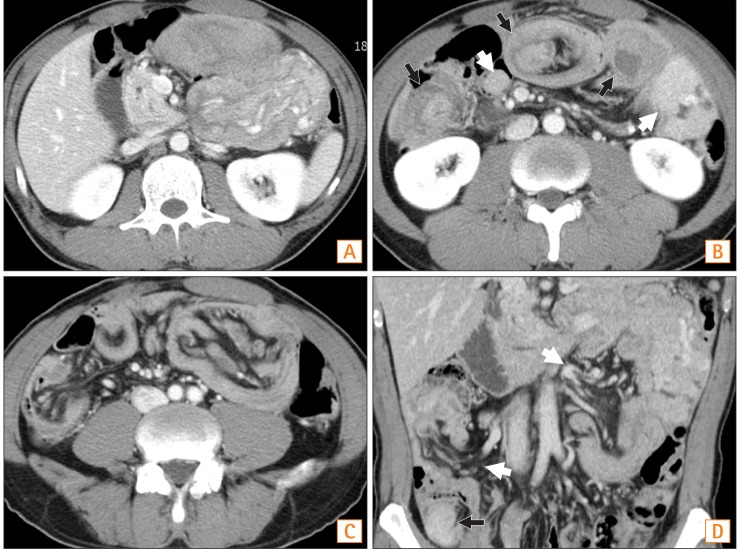
After the patient's admission to the hospital, no abnormalities were identified in a physical exam and blood test. The patient showed characteristic mucocutaneous pigmentation (Fig. 2). A small bowel radiology series showed large fungating hamartomatous polyps, prominent bowel dilatation, and intussusception in the proximal jejunal loop and the ileal loop (Fig. 3). 2 days after admission an abdominopelvic CT was performed; the findings were similar to those of the small bowel series and included large fungating polyps, as well as intussusceptions in the jejunal and ileal loops (Fig. 4). During the tests, intestinal intussusceptions were observed, but the patient did not complain of any symptoms.
We performed colonic endoscopic mucosal resection (EMR) 2 days in a row and removed a very large ileal polyp (3 cm) and 22 colonic polyps. All polyps measuring 5 mm or more were removed. The procedure times were 2 hours 20 minutes and 1 hour 10 minutes. The next day, we performed duodenal and proximal jejunal EMR by using detachable snares and hemoclips via colonoscopy (CF-H260AI; Olympus, Tokyo, Japan) because the surgical approach appeared to be difficult. Nine duodenal and proximal jejunal polyps were removed. The procedure time was 54 minutes. At the end of the procedure, the patient exhibited irritability, severe abdominal pain, shortness of breath, and decreased blood pressure. A physical exam revealed severe abdominal distension and a board-like abdominal wall. Clinically, it was not bowel perforation, but we presumed iatrogenic abdominal compartment syndrome caused by severe air distension following the long surgical procedures. Endoscopic decompression was attempted but unsuccessful. The patient was immediately intubated, and after 6 hours of ventilator care, the patient recovered completely.
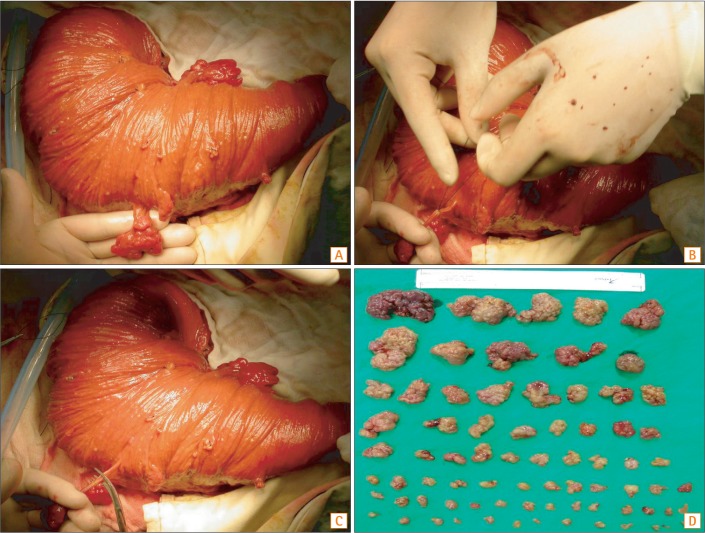
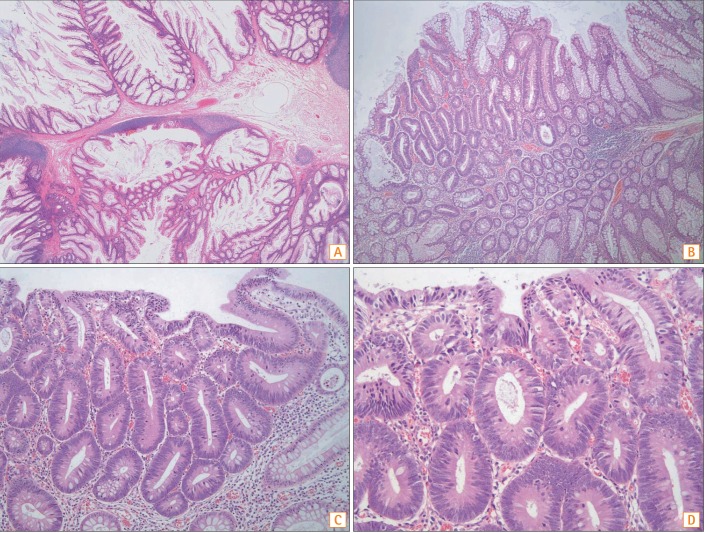
The patient did not want frequent endoscopic procedures. We considered a method to remove all of the polyps at one time. After one month, the patient underwent elective laparotomy to remove the remaining jejunal and ileal polyps. Enterotomy was performed at 1 site on the jejunum and 3 sites on the ileum. The incision was made longitudinally along the lumen, with an incision length similar to the circumference of the small bowel. The small bowel was evaginated, and the length of the evaginated bowel was about 50 cm near the incision site in the jejunum and 10-20 cm in the ileum. Evagination of a longer length was possible in the jejunum, probably because of prominent bowel dilatation because of numerous polyps and frequent intussusceptions over a long period. Next, we performed an operative polypectomy without small bowel resection. Nearly the entire small bowel was observed. We attempted to remove all polyps larger than 1 cm. A total of 76 polyps were surgically removed (Fig. 5). The procedure time was 4 hours 25 minutes. After this procedure, an intraoperative endoscopic examination was performed to check for remnant small bowel polyps, and there were no polyps of significant size (>1 cm). Histologic examination of the polyps removed from the colon and small bowel showed typical hamartomatous polyps characterized by tree-like branching bands of smooth muscle with normal surrounding hyperplastic epithelium (Fig. 6A). One colonic polyp showed high-grade dysplasia (Fig. 6B-D).
After the operative and endoscopic polypectomy, the patient did not exhibit any GI symptoms such as abdominal pain or bloody stool and could tolerate an oral diet. For chemoprevention, we considered using celecoxib or aspirin, but celecoxib was excluded because of adverse cardiovascular effects with long-term use. We tried to use aspirin, but this treatment was soon stopped because of an allergic reaction (including facial edema and flushing). The patient does not currently take any medication. One year after the procedures, a capsule endoscopy was performed to check for small and large bowel polyps. This revealed multiple tiny ileal polyps, but no polyps larger than 1 cm were detected.
DISCUSSION
PJS is a rare autosomal dominant inherited syndrome consisting of GI hamartoma and mucocutaneous hyperpigmentation; it has an estimated prevalence of 1 in 120,000 live births, without racial or sexual predilection.8 In patients with PJS, polyps begin to grow in the first decade of life and produce clinical symptoms such as intestinal intussusceptions. The first symptoms most commonly appear during the second decade of life; therefore, surgical interventions begin at a relatively young age.4,9 Polyp-induced complications, especially intussusception and resulting bowel obstruction, are the major cause of the repeated laparotomies that are major problem in the management of patients with PJS.4,10 Choi et al. reported that repeated laparotomies are performed in about 43% of Korean patients with PJS.9 According to reports, short bowel syndrome resulting from repeated bowel resection is not uncommon. Thus, efforts to reduce the number of laparotomies are important in managing patients with PJS.11
Recently, some reports have shown that minimal invasive endoscopic treatment of PJS polyps via enteroscopy instead of surgery is safe and easy.5,6,7 However, the difficulty of performing a polypectomy is related to the number and location of polyps. The number of polyps in PJS is usually in the range of 10 to 100. About 25% of patients have fewer than 10 polyps, and about 10% have more than 100.9 When there are fewer polyps, enteroscopic polypectomy can be attempted in the small bowel. The jejunoileum is the most frequent site of polyps, followed by the colorectum, stomach, and duodenum. Polyps in the stomach, duodenum, and colon can be removed relatively easily through endoscopy. In a recent report by Akarsu et al.,12 all small bowel polyps in 7 patients with PJS were removed by performing double balloon endoscopy (DBE). Thirty one DBE procedures were performed in the 7 patients, an average of 4.4 procedures per patient. The number of polyps per patient ranged from 2 to 26, and 110 of the total removed polyps measured more than 1 cm. In spite of having fewer polyps than our patient, these patients underwent DBE individually up to seven times. Our patient would have required many more DBEs. These frequent DBEs can be more time-consuming, more difficult, and not cost-effective; furthermore, they are associated with a high risk of complications and a failure to remove the polyps in the small bowel completely. Given our patient's large number of polyps and prior abdominal surgical history, it may not have been possible to remove dozens of large jejunal and ileal polyps through DBE because of extended procedure time, air over-distension, incomplete resection, and high risk of complications. In our patient, the procedure time for duodenal and proximal jejunal EMR for 9 polyps was just 54 minutes. However, the patient experienced serious iatrogenic abdominal compartment syndrome, probably because of adhesions due to 3 previous laparotomies and air over-distension. Of course, this might have been prevented by using a CO2 gas inflator. Intraoperative endoscopic polypectomy can also be considered to avoid unnecessary enterotomy or bowel resection. However, in reality, it was difficult to apply in our case because of previous multiple laparotomies and too many small bowel polyps.
We did not perform small bowel resection. Instead, enterotomy was performed at 4 sites on the small bowel, and we evaginated the bowel, tying and cutting the stalk bases of polyps. Tying and cutting of polyps via evagination may be more effective than endoscopic polypectomy for prevention of bleeding because of the presence of multiple pedunculated polyps with thick stalks and large vessels (Fig. 1F). Evagination provided access to the Treitz ligament area because the bowel, especially the jejunum, was prominently dilated by many polyps and repeated intussusceptions over a long time. This evagination technique may not be generally applicable to other patients with PJS without prominent small bowel dilatation. If the bowel is not prominently dilated, enterotomy should be performed frequently because the length of the small bowel that can be evaginated is short. However, if the bowel lumen is dilated enough to cause intussusceptions, evagination could be considered. Before this case, the evagination of such a long bowel segment had not been reported.
In most cases of PJS, the polyp locations were identified by palpating the outside of the small bowel; enterotomy was then performed near the polyp, and the bowel was resected. 13,14,15,16 In these cases, the number of polyps was relatively small. Intraoperative enteroscopic polypectomy usually was performed at the same time. In the current case, we successfully removed 76 polyps without serious complications via operative polypectomy. By minimizing the number of enterotomies without bowel resection and using evagination, physicians might able to reduce the frequency of serious complications such as postoperative adhesions and short bowel syndrome in patients with PJS with high risks for repeated surgical procedures. After the surgical procedure, we performed an intraoperative endoscopic examination to check for remaining small bowel polyps, and there were no polyps of significant size (>1 cm). The total operative procedure time was 4 hours 25 minutes. If we had performed an intraoperative endoscopic polypectomy, the procedure would have been more time-consuming and very difficult. Instead, we successfully removed more than 100 polyps without serious complications through 3 endoscopic polypectomies and an operative polypectomy. By providing a "clean sweep" of the small intestine, combined operative and endoscopic polypectomy can reduce the rate of repeat laparotomy and future polyp-related complications.
Patients with PJS have a very high risk of malignancies in several organs. According to Spigelman et al.,10 the relative risk of GI cancer may be estimated to be 13 times, and the relative risk of non-GI tumors may be 9 times than in the normal population. The transformation of some hamartomatous polyps into adenomatous growths and subsequent carcinoma has been documented.17,18 In addition to the high prevalence of cancer in patients with PJS, survival is also impaired, with the risk of mortality from cancer approaching 40% by 40 years of age.10 In our case, high-grade dysplasia was observed in 1 polyp (out of more than 100 polyps removed). This polyp did not show characteristic gross findings distinguishing it from other polyps. Therefore, we recommend the removal, if possible, of all polyps larger than 1 cm. Such cases suggest that many cases of GI cancer could be prevented by careful screening and removal of GI polyps.
Recent studies have demonstrated the chemo-preventive efficacy of rapamycin on PJS in a mouse model. Katajisto et al. reported that rapamycin effectively blocks phospho-S6, indicating inactivation of the mammalian target of rapamycin pathway.19 Rapamycin treatment led to a dramatic reduction in polyp burden and size. A significant reduction in microvessel density was seen in polyps from the rapamycin-treated mice compared with those from the control group. The antiangiogenic effect of rapamycin may play a role in polyp reduction. Rapamycin analogues, such as everolimus, which have recently been approved for the treatment of renal cell carcinoma and are being used in more than 50 ongoing clinical trials, could one day be used for treating patients with PJS. The presence of cyclooxygenase 2 (COX-2) expression in PJS carcinomas and dysplastic hamartomas provides a rationale for chemoprevention with nonsteroidal anti-inflammatory drugs or COX-2 inhibitors. Udd et al. reported that celecoxib treatment initiated before polyposis leads to a dramatic reduction in tumor burden and may be associated with decreased vascularity of the polyps.20 In spite of late start oftreatment after expression of polyposis, celecoxibleads to a significant reduction in large polyps. This suggests that COX-2 chemoprevention is beneficial in the treatment of PJS. However, until now, rapamycin analogues have not been commercialized for PJS, and celecoxib use is not recommended because of cardiovascular side effects from long-term use.21 We tried to use aspirin for chemoprevention in our patient because he had a very high genetic risk of GI malignancy. However, our patient had side effects from the aspirin, and now no chemoprevention is being used.
Burt et al. recommended endoscopic investigation of the upper and lower GI tract every 3-5 years, in addition to radiography of the small bowel.22 Many centers now use capsule endoscopy instead of radiography of the small bowel. This appears to be at least as accurate as barium follow-through, is preferred by patients, and reduces radiation exposure. Some authors recommend more frequent screening, especially in connection with the possibility of malignant change in the polyps.1 To date, there is no standardized guideline for endoscopic surveillance. Additionally, there are no reports that frequent screening reduces the number of laparotomies resulting from small-bowel intussusceptions. However, the accurate information about small bowel polyps that can be provided by frequent screening and preemptive polyp resection for polyps larger than 1 cm will prevent emergency laparotomies resulting from bowel intussusceptions and reduce the development of GI cancer.
In conclusion, prophylaxis and polypectomy of the entire GI tract is the gold standard for treating patients with PJS. Combined endoscopic and operative polypectomy achieves a clean intestine and may allow relatively long asymptomatic periods. Combined treatment is particularly important for patients who will undergo repeated surgical interventions because of clinical symptoms while they are still young. In our case, we performed combined operative and endoscopic polypectomy for polyp removal from the entire GI tract in a high-risk patient who had 3 previous surgeries. To date, our patient is free of any overt intestinal occlusion symptoms or other symptoms of PJS. In the future, careful follow-up will be needed for cancer prevention and early detection in the GI tract and other organs.