15-Hydroxyprostaglandin dehydrogenase as a marker in colon carcinogenesis: analysis of the prostaglandin pathway in human colonic tissue
Article information
Abstract
Background/Aims
Cyclooxygenase-2 (COX-2), 15-hydroxyprostaglandin dehydrogenase (15-PGDH), and microsomal prostaglandin E synthase-1 (mPGEs-1) regulate prostaglandin E2 (PGE2) expression and are involved in colon carcinogenesis. We investigated the expression of PGE2 and its regulating genes in sporadic human colon tumors and matched normal tissues.
Methods
Twenty colonic adenomas and 27 colonic adenocarcinomas were evaluated. COX-2 and 15-PGDH expression was quantified by real-time polymerase chain reaction. The expression of PGE2 and mPGEs-1 was measured using enzyme-linked immunosorbent assay and Western blotting, respectively.
Results
The expression of COX-2, mPGEs-1, and PGE2 did not differ between the adenomas and matched distant normal tissues. 15-PGDH expression was lower in adenomas than in the matched normal colonic tissues (P<0.001). In adenocarcinomas, mPGEs-1 and PGE2 expression was significantly higher (P<0.001 and P=0.020, respectively), and COX-2 expression did not differ from that in normal tissues (P=0.207). 15-PGDH expression was significantly lower in the normal colonic mucosa from adenocarcinoma patients than in the normal mucosa from adenoma patients (P=0.018).
Conclusions
Early inactivation of 15-PGDH, followed by activation of COX-2 and mPGEs-1, contributes to PGE2 production, leading to colon carcinogenesis. 15-PGDH might be a novel candidate marker for early detection of field defects in colon carcinogenesis.
INTRODUCTION
The concept of “field defect” or “field cancerization” in carcinogenesis originates from a report about the frequent multiplicity of oral squamous cell carcinoma in 1953.1 Simultaneous occurrence of multiple adenomas or sequential recurrence of adenomas after curative removal of the primary tumor suggests the presence of field defects; it might contribute to tumor development in colon carcinogenesis.23 Several studies have found differences in the molecular characteristics of cancerous tissues and matched normal colonic tissues. According to these studies, CEA, O6-methylguanine-DNA methyltransferase (MGMT) gene promoter, and cyclooxygenase-2 (COX-2) have been suggested as field defect markers in colon carcinogenesis.456 Of these, COX-2 is overexpressed in human colon cancer, and it contributes to the carcinogenesis by producing prostaglandin E2 (PGE2).7891011 In addition to COX-2, 15-hydroxyprostaglandin dehydrogenase (15-PGDH) and microsomal prostaglandin E synthase-1 (mPGEs-1) play important roles in colon carcinogenesis. The expression of 15-PGDH, which converts biologically active PGE2 to inactive keto-PGE2, is markedly reduced in colonic neoplasia;121314 it has been also shown to be a tumor suppressor in human gastrointestinal carcinogenesis.12151617 On the other hand, mPGEs-1, which converts prostaglandin H2 (PGH2) to PGE2, was found to be overexpressed in human colorectal adenoma and adenocarcinoma, compared to the matched normal tissues.18 Therefore, as a continuum of PGE2 production in colorectal carcinogenesis, suppression of 15-PGDH and overexpression of COX-2 and mPGEs-1 are anticipated in colorectal neoplasm. We previous suggested that 15-PGDH in the normal colorectal mucosa is a potential biomarker of the field effect in carcinogenesis.14 However, the potential usefulness of COX-2, 15-PGDH, and mPGEs-1 as a set of diagnostic or phenotypic markers for field defect in colon carcinogenesis has not been evaluated. If the expression gradient of COX-2 and 15-PGDH in the normal colonic mucosa is present and is related to the distance from the neoplastic tissue, these molecules can be suggested to be field defect markers. Moreover, if COX-2, mPGEs-1, 15-PGDH, and PGE2 are markers of field defects in colon carcinogenesis, the expression or level of these molecules may differ between the normal tissues matched with adenoma and the normal tissues matched with adenocarcinoma. We evaluated the expression of COX-2, mPGEs-1, and 15-PGDH in human colonic neoplasms and matched normal tissues to assess the potential of these enzymes as field defect markers in colon carcinogenesis.
METHODS
1. Patients
Twenty adenoma patients, who underwent colonoscopic polypectomy, were prospectively enrolled for tissue sampling, and 27 adenocarcinoma patients, whose samples were deposited in the institutional tissue bank, were enrolled in the study. Five patients with normal colonoscopic findings in their screening colonoscopies were enrolled as the control group. The control group had no history of systemic inflammatory diseases, malignancies, and/or medications influencing PG metabolism, such as aspirin and NSAIDs. This study was approved by the Institutional Review Board of Asan Medical Center.
2. Sample Collection
Human colonic adenoma tissues were obtained by biopsy during colonoscopic polypectomy. In addition to the adenoma, the “adjacent normal” (within 1 cm from the adenoma) and “distant normal” (at least 10 cm from the adenoma) tissues were obtained from the same patients. Normal colonic mucosal tissues from the ascending colon and rectum of five patients with normal colonoscopic findings were also obtained. All samples were transiently maintained in liquid nitrogen and refrigerated at −70℃. Human colorectal adenocarcinomas and their matched normal tissues were sampled from surgically excised specimens within 60 minutes of excision, and then deposited in the institutional tissue bank, with the patient's consent, until further use. The obtained normal colonic mucosa matched with colonic adenocarcinoma was, at the least, 10 cm away from the primary tumor. All processes related to human tissue sampling were performed after obtaining informed consent.
3. Quantitative Real-Time PCR
Total RNA was extracted using the RNeasy kit (Qiagen, Germantown, MD, USA). The concentration and quality of RNA samples were determined using the NanoDrop-1000 spectrophotometer (NanoDrop Technologies Inc., Wilmington, DE, USA), which were processed to cDNA with Multi-Scribe™ reverse transcriptase (Applied Biosystems, Foster City, CA, USA). Approximately 40 ng of the sample was used for the real-time PCR assay for 15-PGDH and COX-2, which was performed using Applied Biosystem® 7500 Real-Time PCR system. The real-time PCR assay for 15-PGDH and COX-2 was performed using the human 15-PGDH TaqMan probe/primer kit (Hs 00168359_m1; Applied Biosystems) and the human COX-2 TaqMan probe/primer kit (Hs 00153133_m1; Applied Biosystems). β-Actin was amplified using the human ACTB TaqMan primer/probe kit (Hs 99999903_m1; Applied Biosystems). Primer sequences of the target genes for real-time PCR are as follows: 15-PGDH: forward primer, TTA TTG TTT GTC CGT CTA TTT CGT GA and reverse primer, CAC CAG CGC TAC CTA TAG ACA AGA; COX-2: forward primer, TAT TTC TGA AAC CCA CTC CAA ACA and reverse primer, TAA TTG CAT TTC GAA GGA AGG G; and β-actin: forward primer, TCC CTG GAG AAG AGC TAC GA and reverse primer, AGG AAG GAA GGC TGG AAG AG. The relative gene expression was normalized to mRNA of β-actin and calculated by 2-ΔΔCt method. The level of 15-PGDH expression in the FET cells treated with tumor necrosis factor for 72 hours, and the expression of COX-2 in the normal tissues from an adenoma patient were used to determine the relative expression level of each gene.
4. Western Blot
Tissue lysates were prepared by pipetting cell lysis buffer (cell signaling; 20 mM Tris-HCL/150 mM NaCl/1 mM Na2EDTA/1 mM EGTA/1% Triton/2.5 mM sodium pyrophosphate/1 mM β-glycerophosphate/1 mM NaVO/1 µg/mL leupeptin) with 1 mM phenylmethylsulfonyl fluoride separated on 12.5% polyacrylamide gels (50 µg per lane), and transferred to immobilon polyvinylidene difluoride membrane. The blots were probed with PGEs-1 monoclonal antibody at 1:1,000 dilution in 5% bovine serum albumin, and then anti-β-actin antibody was prepared at 1:10,000 dilution in 5% milk, developed using peroxidase-conjugated goat anti-mouse antibodies, and visualized using an ECL plus detection kit (Amersham Pharmacia Biotech, Inc. Piscataway, NJ, USA), following the manufacturer's instructions and then exposed to Kodak CP-BU film (Rochester, NY, USA). Expression level of mPGEs-1 was normalized to β-actin and quantified using imaging analyzer (Bio-Rad Laboratories, Hercules, CA, USA).
5. ELISA
PGE2 was analyzed by an enzyme immunoassay according to the protocol supplied by the manufacturer (Assay Designs Inc., Ann Arbor, MI, USA) and quantified with Spectra Max (Molecular Devices, Sunnyvale, CA, USA).
6. Measurement of COX-2, 15-PGDH, and mPGEs-1 Expression and PGE2 Level
COX-2, 15-PGDH, and mPGEs-1 expression and PGE2 level were measured in 20 adenoma tissues, 20 distant normal tissues matched for each adenoma, and 20 normal tissues adjacent to each adenoma from 20 adenoma patients. COX-2, 15-PGDH, and mPGEs-1 expression and PGE2 level were measured in 27 adenocarcinomas and 27 normal tissues were matched for each adenocarcinoma from 27 adenocarcinoma patients. The relative expression of PGE2 and its related enzymes in the neoplastic tissues were assessed by calculating the ratio of each neoplastic tissue and its matched distant normal mucosa. A ratio of >1 was defined as increased expression of each molecule in the neoplastic tissues compared to that in the distant normal mucosa.
7. 15-PGDH Immunohistochemistry
Immunohistochemical staining for 15-PGDH in the adenomas and adenocarcinomas was performed using a monoclonal anti-15-PGDH antibody (kind gift from Prof. Sandy D. Markowitz, Cleveland, OH, USA).16 All slides were reviewed by one pathologist (Mi-Jung Kim) who specialized in gastrointestinal pathology. The immunohistochemistry score was assessed according to the stained area, as follows: 0, specimens with 0% to 25% of stained area; 1, specimens with 26% to 50% of stained area; 2, specimens with 51% to 75% of stained area; and 3, specimens with 76% to 100% of stained area.
8. Data Analysis
Student t-test was performed after log-transformation of the relative expression due to the skewed distribution of data. All P-values were two-sided, with a P-value less than 0.05 regarded as statistically significant. All analyses were performed using SPSS for Windows version 17.0 (SPSS Inc., Chicago, IL, USA).
RESULTS
1. Characteristics of the Patients
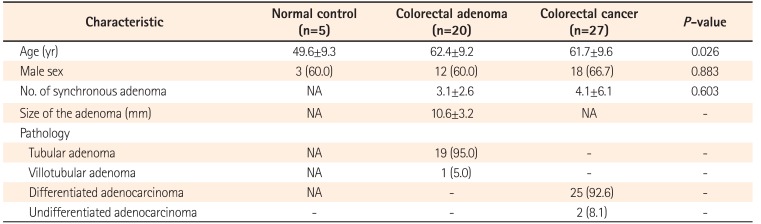
Tissues were obtained from 20 adenoma and 27 adenocarcinoma patients. Characteristics of the normal controls and patients with colorectal neoplasm are summarized in Table 1.
Characteristics of the Normal Controls and Patients with Colorectal Adenoma and Cancer
2. Relative Expression of COX-2, 15-PGDH, mPGEs-1, and PGE2: Comparison between Neoplastic Tissues and Their Matched Distant Normal Mucosa
Because of the limited volume of the matched normal tissue specimens, COX-2 mRNA expression could not be measured in five adenoma and two adenocarcinoma patients and mPGEs-1 expression could not be measured in four adenoma patients.
In relation to the matched normal tissues, COX-2 expression was increased in 10 of 15 adenomas (66.7%) and 13 of 25 adenocarcinomas (52.0%), and 15-PGDH was decreased in 15 of 20 adenomas (75.0%) and 25 of 27 adenocarcinomas (92.5%). Fig. 1 shows the representative results of Western blot for mPGEs-1, which increased in eight of 16 adenomas (50.0%) and 20 of 27 adenocarcinomas (74.1%). PGE2 was increased in 11 of 20 adenomas (55.0%) and 16 of 27 adenocarcinomas (59.3%).

A representative Western blot for mPGEs-1. After Western blot, expression level of mPGEs-1 was normalized to β-actin and quantified using imaging analyzer to compare normal tissues with adenoma or adenocarcinoma. mPGEs-1, microsomal prostaglandin E synthase-1; N, paired normal tissue of the adenoma or adenocarcinoma; A, adenoma; CA, adenocarcinoma.
3. Quantitative Analysis of COX-2, 15-PGDH, and mPGEs-1 Expression and PGE2 Level
1) Comparison between Adenoma and Matched Normal Tissue
In the subgroup analysis, the expression of COX-2, mPGEs-1, and PGE2 did not differ between the adenomatous and matched distant normal tissues (P=0.195, P=0.095, and P=0.347, respectively). In contrast, the difference in the expression of 15-PGDH between the adenomas and distant normal tissues remained significant (P<0.001) (Fig. 2). Compared to the distant normal tissues, the expression of COX-2, mPGEs-1, and PGE2 in the adjacent normal tissue increased in 30.8% (4/15), 18.8% (3/16), and 55% (11/20) of samples and the expression of 15-PGDH in the adjacent normal tissue decreased in 40% (8/20) of samples. There was no significant difference in the expression of COX-2 (P=0.948), mPGEs-1 (P=0.382), PGE2 (P=0.576), and 15-PGDH (P=0.302) between the distant normal mucosa and adjacent (within 1 cm from the adenoma) normal mucosa samples from adenoma patients.
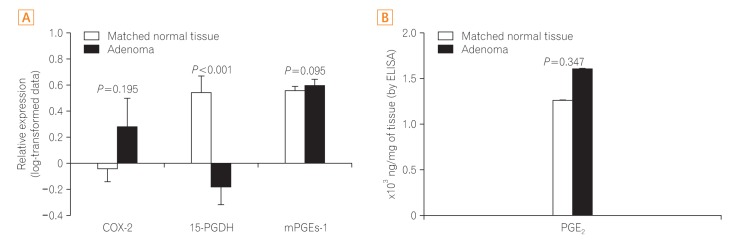
Comparison between colonic adenoma and matched normal colonic tissue. (A) Expression of COX-2 and 15-PGDH was measured by quantitative real-time PCR; relative expression is presented as log-transformed data. After Western blotting, mPGEs-1 expression normalized to β-actin was further quantified using imaging analyzer; data have been presented as log-transformed values. (B) PGE2 level, as measured by ELISA. Statistical analysis was performed using log-transformed data, but the figure shows the data after back transformation. COX-2, cyclooxygenase-2; 15-PGDH, 15-hydroxyprostaglandin dehydrogenase; mPGEs-1, microsomal prostaglandin E synthase-1; PGE2, prostaglandin E2.
2) Comparison between Adenocarcinoma and Their Matched Normal Tissue
COX-2 expression did not differ between the adenocarcinomas and matched normal tissues (P=0.209), while mPGEs-1 and PGE2 were overexpressed or overproduced in the adenocarcinomas compared with the matched normal tissues (P<0.001 and P=0.020, respectively). The expression of 15-PGDH in the adenocarcinomas was significantly lesser compared to the matched normal tissues (P<0.001) (Fig. 3).
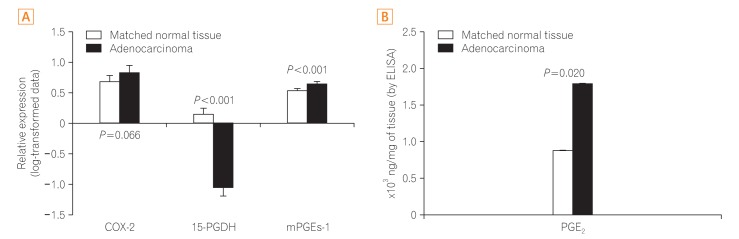
Comparison between colonic adenocarcinoma and matched normal colonic tissue. (A) Expression of COX-2 and 15-PGDH was measured using quantitative real-time PCR; relative expression is presented as log-transformed data. After Western blotting, mPGEs-1 expression normalized to β-actin was quantified using imaging analyzer. This is presented as log-transformed data. (B) PGE2 level, as measured by ELISA. Statistical analysis was performed using log-transformed data, but the figure shows the data after back transformation. COX-2, cyclooxygenase-2; 15-PGDH, 15-hydroxy-prostaglandin dehydrogenase; mPGEs-1, microsomal prostaglandin E synthase-1; PGE2, prostaglandin E2.
3) Comparison between Colonic Adenoma and Adenocarcinoma
Both COX-2 overexpression and 15-PGDH repression were more prominent in the adenocarcinoma tissue than in the adenoma tissue (P=0.015 and P<0.001, respectively) (Fig. 4). However, the level of mPGEs-1 and PGE2 did not differ between adenoma and adenocarcinoma tissues (P=0.308 and P=0.842, respectively) (Fig. 4).
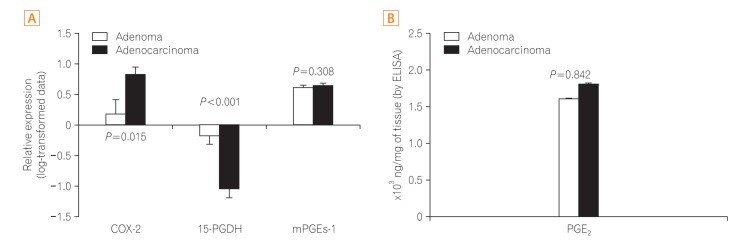
Comparison between colonic adenoma and adenocarcinoma. (A) Expression of COX-2 and 15-PGDH was measured by quantitative real-time PCR; relative expression is presented as log-transformed data. After Western blotting, mPGEs-1 expression normalized to β-actin was quantified using imaging analyzer. This has been presented as log-transformed data. (B) PGE2 level, as measured by ELISA. Statistical analysis was performed using log-transformed data, but the figure shows the data after back transformation. COX-2, cyclooxygenase-2; 15-PGDH, 15-hydroxyprostaglandin dehydrogenase; mPGEs-1, microsomal prostaglandin E synthase-1; PGE2, prostaglandin E2.
4. COX-2 and 15-PGDH Expression among Normal Colonic Tissues from Each Subgroup
COX-2 expression in the distant normal colonic tissue was higher in the adenocarcinoma patients than in the adenoma patients (P<0.001). Likewise, 15-PGDH expression was significantly lower in the distant normal colonic tissue of adenocarcinoma patients than in that of the adenoma patients (P=0.018) (Fig. 5). In comparison to the normal colonic tissues from persons without colonic neoplasm (normal subjects, n=5), COX-2 was overexpressed in the normal colonic tissues from adenocarcinoma patients, but not overexpressed in the normal colonic tissues from adenoma patients (Fig. 5). 15-PGDH expression level was significantly lower in the normal tissues from normal subjects than in the normal tissues from patients with adenoma or adenocarcinoma (Fig. 5). In the adenoma and adenocarcinoma groups, both COX-2 and 15-PGDH expression of normal colonic tissue showed no significant association with the age group (<50 years vs. ≥50 years), sex, and presence of synchronous adenomas.
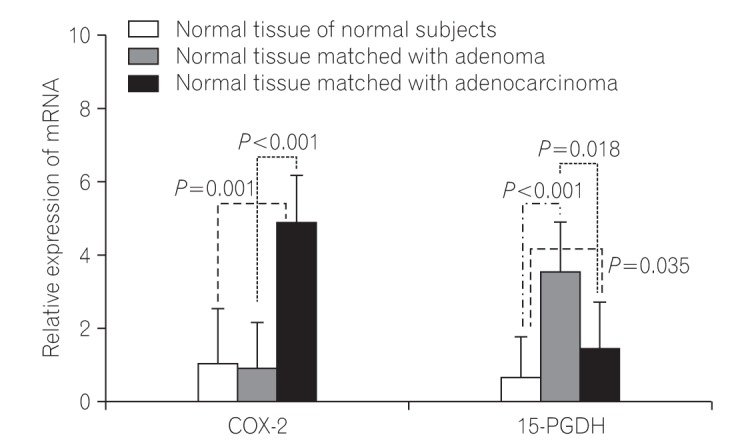
Comparison of normal colonic tissues from normal subjects (white bar), patients with adenoma (gray bar), and patients with adenocarcinoma (black bar). COX-2 and 15-PGDH expression, as measured by quantitative real-time PCR. The data are presented after back transformation. COX-2, cyclooxygenase-2; 15-PGDH, 15-hydroxyprostaglandin dehydrogenase.
5. 15-PGDH Immunohistochemistry
Immunohistochemical staining was performed for 20 adenomas and 21 adenocarcinomas; the results are summarized in Fig. 6. Eighteen of 21 (85.7%) adenocarcinoma samples and 16 of 20 (80%) adenoma samples scored 0 in immunohistochemical staining.
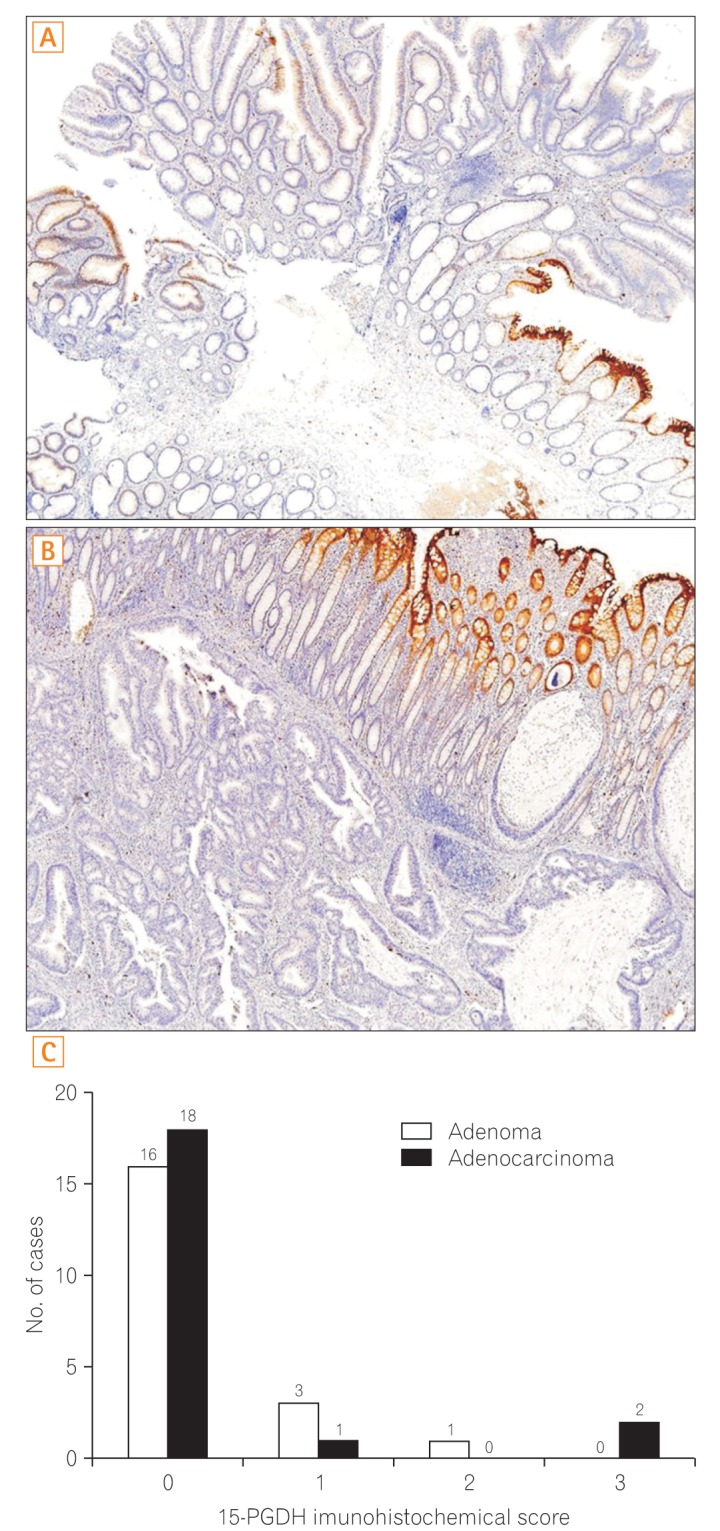
15-PGDH immunohistochemistry in the colonic adenoma and adenocarcinoma. (A) Colonic tubular adenoma. The adenomatous tissue stained weakly for 15-PGDH immunohistochemistry. The adjacent normal tissue on the left side of the adenoma was highly positive for 15-PGDH. (B) Colonic adenocarcinoma. The carcinomatous tissue remains unstained. On the contrary, the adjacent normal tissue stained strongly. (C) Graphical representation of 15-PGDH immunohistochemical staining scores for both colonic adenomas and adenocarcinomas. 15-PGDH, 15-hydroxyprostaglandin dehydrogenase.
DISCUSSION
Our study revealed that 15-PGDH expression was markedly decreased in both adenoma and adenocarcinoma, compared to their matched normal tissues. However, the up-regulation of mPGEs-1 and PGE2 was observed only in the adenocarcinoma group, not in the adenoma group. Moreover, COX-2, a well-known enzyme to contribute to colon carcinogenesis, did not show significant overexpression in both adenoma and adenocarcinoma compared to the matched normal tissues. This finding suggests that among PGE2 and related enzymes, 15-PGDH expression might change during colon carcinogenesis, and therefore, it can be a sensitive marker reflecting the carcinogenic property of the patients' colons.
Given the hypothesis that 15-PGDH expression might be the most sensitive indicator among PGE2-related enzymes in colon carcinogenesis, we anticipated some differences in 15-PGDH expression between the normal colonic tissues from normal subjects and patients with colonic neoplasms. However, the results obtained opposed this. 15-PGDH mRNA expression was not higher, but lower, in the colonic mucosa of normal subjects than that in the normal colonic mucosa of patients with colonic neoplasms. The reason underlying this decreased 15-PGDH mRNA expression in the normal colonic mucosa of healthy subjects is unclear. This finding may suggest the differential 15-PGDH expression pattern between the normal colonic mucosa with no or insignificant field defects and the normal colonic mucosa under the influence of field defects or carcinogenic effects. Further investigation is necessary to elucidate the different expression patterns of 15-PGDH in the normal colonic mucosa from each group.
A previous study suggested that COX-2 can function as a field defect marker in colorectal cancer.5 On the basis of this finding, we hypothesized the presence of an expression gradient of PGE2 or its related enzymes in the normal colonic tissue according to the distance from the neoplastic tissue. To elucidate it, we compared distant normal tissue with adjacent normal tissue in the adenoma group on the basis of PGE2 level and the expression of COX-2, mPGEs-1, and 15-PGDH. However, we did not observe any difference. Although we failed to elucidate the presence of an expression gradient of PGE2 or its related enzymes in the colonic adenoma group, our study provided another interesting finding. It revealed relative COX-2 overexpression and 15-PGDH repression in the normal colonic mucosa matched with the adenocarcinomas compared to the normal mucosa from the adenomas. This expression pattern of COX-2 and 15-PGDH in the normal mucosa of colon adenocarcinoma may reflect the “more cancer-prone property” or “more advanced field defect” of colon adenocarcinoma patients. However, we could not evaluate the presence of histological characteristics in the distant normal mucosa of the adenocarcinoma, which could cause COX-2 overexpression and 15-PGDH repression, such as microscopic inflammation.
In our study, the frequency of elevated COX-2 expression in adenocarcinomas was relatively low (52.0%), compared to previous reports.11 We observed prominent COX-2 overexpression in the adenocarcinoma group compared to the adenoma group. Therefore, COX-2 overexpression in the adenocarcinoma, defined by its ratio to COX-2 expression in the normal tissues, might be obliterated by a relatively high COX-2 expression in the normal mucosa matched with the adenocarcinoma considered in our study.
This study has some limitations. First, the histologic characteristics of each patient was not assessed, although the expression of COX-2 and related enzymes might be influenced by the status of inflammation. Second, limited numbers of patients were included, and therefore, selection bias is possible. Moreover, the association between the patients' clinical characteristics and the expression of each molecule could not be evaluated in detail. Nonetheless, our study offered the foundation for future studies to assess the potential usefulness of 15-PGDH as a sensitive marker of field cancerization in colon cancer.
To summarize, mPGEs-1 and PGE2 were overexpressed and 15-PGDH was repressed in the human colonic neoplasms compared to the matched normal tissues. However, only 15-PGDH repression was found to be significant in subgroup (adenoma and adenocarcinoma) analysis. COX-2 and 15-PGDH expression in the normal colonic mucosa differed among normal subjects, adenoma patients, and adenocarcinoma patients. These findings suggest that 15-PGDH can be the most sensitive field defect marker among the PGE2-related enzymes involved in colon carcinogenesis.
ACKNOWLEDGEMENTS
We thank Prof. Sandy D. Markowitz (Case Western Reserve University, Cleveland, OH, USA) for providing antibody reagents as well as for helpful discussions. We also appreciate Mi-Jung Kim (Former Assistant Professor, Department of Pathology, Asan Medical Center, Seoul, Korea) for histological review.
Notes
Financial support: This research was supported by a grant of the Korea Health Technology R&D Project through the Korea Health Industry Development Institute (KHIDI), funded by the Ministry of Health & Welfare, Republic of Korea (No. HI14C1090) and by the Ministry of Trade, Industry & Energy (MOTIE, Korea) under Industrial Technology Innovation Program. No. 10063408.
Conflict of interest: None.