Unraveling molecular similarities between colorectal polyps and colorectal cancer: a systems biology approach
Article information

Abstract
Background/Aims
Colorectal cancer (CRC) and colorectal polyps are intimately linked, with polyps acting as precursors to CRC. Understanding the molecular mechanisms governing their development is crucial for advancing diagnosis and treatment. Employing a systems biology approach, we investigated the molecular similarities between polyp and CRC.
Methods
We analyzed gene expression profiles, protein-protein interactions, transcription factors, and gene ontology to identify common differentially expressed genes (DEGs) and unravel shared molecular pathways.
Results
Our analysis revealed 520 commonly dysregulated genes in polyps and CRC, serving as potential biomarkers and pivotal contributors to disease progression. Gene ontology analysis elucidated distinct biological processes associated with upregulated and downregulated DEGs in both conditions, highlighting common pathways, including signal transduction, cell adhesion, and positive regulation of cell proliferation. Moreover, protein-protein interaction networks shed light on subnetworks involved in rRNA processing, positive regulation of cell proliferation, mRNA splicing, and cell division. Transcription factor analysis identified major regulators and differentially expressed transcription factors in polyp and CRC. Notably, we identified common differentially expressed transcription factors, including ZNF217, NR3C1, KLF5, GATA6, and STAT3, with STAT3 and NR3C1 exhibiting increased expression.
Conclusions
This comprehensive analysis enriches our understanding of the molecular mechanisms underlying polyp formation and CRC development, providing potential targets for further investigation and therapeutic intervention. Our findings contribute substantively to crafting personalized strategies for refining the diagnosis and treatment of polyps and CRC.
INTRODUCTION
Colorectal cancer (CRC) is a major global health concern, ranking as the third most commonly diagnosed cancer and the second leading cause of cancer-related deaths worldwide [1]. CRC arises through a multistep process, starting with the formation of polyps in the colon or rectum, which can progress to adenomas and eventually develop into invasive carcinoma [2]. Polyps are abnormal tissue growths that can develop in various parts of the body, including the colon and rectum [3]. Colorectal polyps are common and can be benign (non-cancerous) or malignant (cancerous) [4]. CRC is a type of cancer that starts in the colon or rectum and is the most commonly diagnosed cancer type in Spain [5]. The primary risk factor for CRC is age, with 90% of all diagnosed patients aged over 50 years [6]. The prognosis of CRC mainly depends on the tumor stage, with the 5-year survival rate decreasing from 91% in the early stage to around 10% in the advanced stage [7]. The prevalence of colorectal polyps and cancer is significant. In a study conducted in China, 2,064 colorectal polyp cases were identified among 6,783 eligible participants between March 2018 and December 2019. Certain dietary factors, such as meat consumption, have been linked to an increased prevalence of colorectal polyps. For instance, higher poultry consumption was significantly related to a higher polyp prevalence [8]. Microsatellite instability (MSI) is a key biomarker in CRC, with crucial diagnostic, prognostic, and predictive implications [9,10]. Testing for mismatch repair deficiency (MMR-D)/MSI is recommended during screening for Lynch syndrome, an autosomal-dominant hereditary disease characterized by germline mutations in the MMR genes and associated with an increased risk for several types of cancer [11]. MSI-high status is associated with a better prognosis in early-stage CRC and a lack of benefit from adjuvant treatment with 5-fluorouracil in stage II disease. More recently, MSI has emerged as a predictor of sensitivity to immunotherapy-based treatments, opening a new therapeutic scenario for patients with these tumors [12].
In this study, we employed a systems biology approach to investigate the similarities between polyp and CRC at the molecular level. Specifically, we focused on the analysis of differentially expressed genes (DEGs) using protein-protein interaction (PPI) networks, transcription factor (TF) analysis, and gene ontology (GO) analysis. By integrating these different analytical approaches, we aimed to identify common DEGs that are dysregulated in both polyp and CRC. These shared DEGs may represent key molecular players and pathways that contribute to the progression of polyps to CRC. To the best of our knowledge, this study represents one of the first comprehensive analyses of the shared molecular features between polyp and CRC using a systems biology approach. By elucidating the molecular similarities between these 2 conditions, our findings have the potential to contribute to the development of precision medicine strategies that target shared pathways and improve patient outcomes.
METHODS
1. Data Collection and Preprocessing
For this study, we collected gene expression data from 2 groups: patients diagnosed with colorectal polyps and patients diagnosed with CRC. Additionally, a control group consisting of healthy individuals was included. The datasets used in this study were obtained from (http://www.ncbi.nlm.nih.gov/geo/geo2r/), with the accession number GSE41258. These datasets provided the necessary gene expression profiles for our analysis.
2. Differential Expression Analysis
To identify DEGs between the polyp and CRC groups compared to the control group, we performed differential expression analysis. The analysis was conducted using limma package in the R software, which allows for the comparison of gene expression levels between different sample groups. Genes with a P-value greater than 0.05 and a log2 fold change outside the range of ± 1 were considered non-significant and excluded from further analysis. Duplicated DEGs were also removed, resulting in a final list of unique DEGs. For our analysis, we utilized a cohort of 186 CRC patients with primary tumor tissue as the treatment group, compared to 102 healthy cases with a normal colon. Similarly, for the polyps, we employed data from 48 patients with colorectal polyps as the treatment group, juxtaposed against 102 healthy cases with a normal colon. This inclusive approach aimed to encompass a broad range of sizes and locations, capturing a representative spectrum of DEGs. The intention was to provide a comprehensive view of molecular alterations associated with polyp and CRC, considering variations in clinical and pathological characteristics.
3. PPI Network Analysis
To investigate the potential PPIs among the identified DEGs, we constructed a PPI network. We utilized STRING database [13] to generate the PPI network based on the list of DEGs. The network was visualized using Cytoscape 3.7.2 and Gephi software v 0.10.1 [14,15]. Additionally, hub genes, which are highly connected nodes in the network, were identified. Subnetwork detection was performed using ClusterONE 1.0 plugin within Cytoscape [16], considering criteria such as minimum size (5), density (0.6), and a P-value ( < 0.05) threshold.
4. TFs Analysis
To investigate the potential regulatory relationships between the DEGs and TFs , we conducted TF analysis. We employed ChEA database [17] to identify TFs within the DEG list based on protein-DNA interaction information obtained through ChIPX tests. Only TFs with a P-value less than 0.05 were considered significant. Based on the TF-target interactions, gene regulatory networks were constructed and subjected to centrality analysis.
5. GO Analysis
To gain insights into the functional characteristics and biological processes (BP) associated with the identified DEGs, we performed GO analysis. The online program DAVID [18] was utilized for this analysis, focusing specifically on BP. The analysis considered the top 10 terms with the highest number of member genes and a P-value below 0.05.
By following these methods, we aimed to comprehensively analyze the gene expression profiles, identify PPIs, investigate TF-gene interactions, and explore the functional annotations of the DEGs. These analyses collectively provide insights into the molecular factors and regulatory networks associated with similarity between CRC and polyp.
RESULTS
1. Gene Expression and Common DEGs
In our study, we analyzed the gene expression profiles of patients diagnosed with colorectal polyps and CRC compared to a control group of healthy individuals. We identified a total of 1,136 DEGs in CRC, with 563 genes upregulated and 573 genes downregulated. Similarly, in polyp samples, we identified 1,353 DEGs, including 611 upregulated genes and 742 downregulated genes (Fig. 1A). To determine the presence of common DEGs between these 2 disease conditions, we utilized a Venn diagram to visualize the overlapping instances (Fig. 1B). The analysis revealed that 520 genes were commonly dysregulated in both CRC and polyps (Fig. 1C). The complete list of common DEGs can be found in Supplementary Table 1. Among the common DEGs, we observed that 267 genes were downregulated (Supplementary Table 2), 245 genes were upregulated (Supplementary Table 3), and 8 genes showed contrasting expression patterns between the 2 diseases (Supplementary Table 4).

Cases the identification of differentially expressed genes (DEGs) in various colorectal disease types. (A) The bar graph provides a visual representation of the DEGs, clearly indicating the count of upregulated and downregulated genes for each specific disease type. (B) The Venn diagram illustrates the overlapping instances of DEGs among different colorectal disease types, enabling a comprehensive comparison. (C) The bar chart demonstrates the fold change in expression of 520 DEGs commonly observed across all disease types. CRC, colorectal cancer.
2. GO Analysis
To gain insight into the functional characteristics and BP associated with the identified DEGs, we performed GO analysis. In CRC, the upregulated genes were enriched in processes such as cell adhesion and signal transduction (Fig. 2A), while the downregulated genes were associated with apoptotic processes and cell division (Fig. 2B). Similarly, in polyps, the upregulated genes were involved in cell adhesion and cell differentiation (Fig. 2C), while the downregulated genes were associated with signal transduction and cell division (Fig. 2D). Moreover, the GO analysis revealed common pathways, including signal transduction, cell adhesion, and positive regulation of cell proliferation, among the DEGs in both CRC and polyps (Fig. 2E).

The findings of the gene ontology analysis for the differentially expressed genes (DEGs). (A) The main biological processes (BP) associated with upregulated genes in CRC. (B) The main BP linked to downregulated genes in CRC. (C) The main BP connected to upregulated genes in polyps. (D) The main BP associated with downregulated genes in polyps. (E) The 10 most significant BP shared by both diseases. The number below the diagram indicates the number of genes involved in the process as a percentage of the total number of genes involved, while, the number in front of the column indicates the number of genes involved in the process. CRC, colorectal cancer.
3. PPI Network Analysis
To explore the protein interactions associated with CRC and polyps, we constructed PPI networks using the STRING database. The PPI network for CRC consisted of 436 nodes and 521 edges, while the polyp network comprised 616 nodes and 978 edges. Subsequently, subnetwork analysis using the “ClusterOne” plugin in Cytoscape identified specific modules associated with ribosomal RNA (rRNA) processing and positive regulation of cell proliferation in CRC (Fig. 3A), and messenger (mRNA) splicing and cell division in polyps (Fig. 3B). Hub nodes within the PPI networks were also identified. Additionally, we constructed a common PPI network using the common DEGs, providing insights into their interactions and functions (Fig. 3C). These findings enhance our understanding of the molecular interactions and functional implications of the identified proteins, highlighting potential targets and pathways for further investigation.

Protein-protein interaction networks with module annotations. The colored nodes represent the modules identified through overlapping neighborhood expansion. The tables provide annotations for the modules, with only those modules having P-values less than 0.05 being chosen. In the network, the color of the nodes indicates the presence of modules, and larger-sized nodes indicate a greater degree of connectivity. (A) Colorectal cancer (CRC) network. (B) Polyp network. (C) Common differentially expressed genes (DEGs) proteins networks.
4. TF Analysis
To elucidate the regulatory relationships between TFs and the DEGs in CRC and polyps, we constructed gene regulatory networks. The analysis revealed 10 TFs predicted as major regulators in CRC and 23 TFs in polyps (Fig. 4A and B). Additionally, we identified common differentially expressed TFs (DE-TFs), including ZNF217, NR3C1, KLF5, GATA6, and STAT3, with STAT3 and NR3C1 exhibiting increased expression (Fig. 4C). Notably, other DE-TFs specific to CRC, such as TCF21, KLF4, PIAS1, FOXO1, and PBX1, were identified, with ZNF217, GATA6, and KLF5 showing downregulation (Fig. 4B). These findings provide insights into the transcriptional regulatory landscape of CRC and polyps, highlighting potential targets for further investigation and therapeutic intervention.
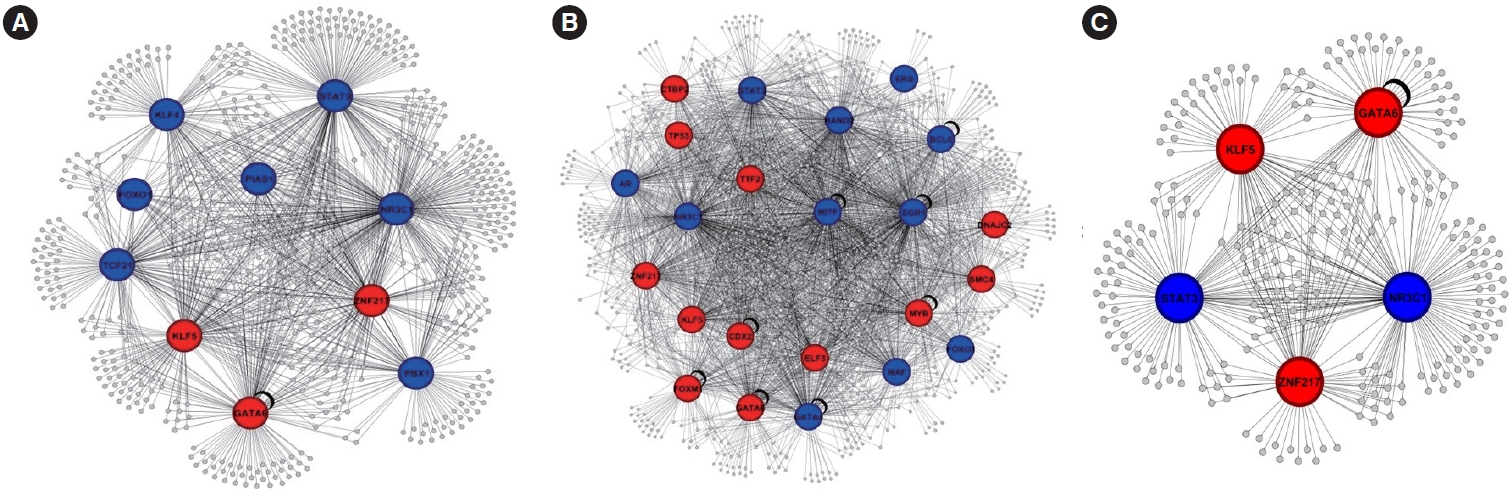
Three gene regulatory networks: (A) the colorectal cancer DE-TF network, (B) the polyp DE-TF network, and (C) the common DE-TF network. In these networks, blue indicates upregulated TFs, while red indicates downregulated TFs. DE-TFs, differentially expressed transcription factors.
DISCUSSION
CRC and colorectal polyps share a close relationship, with polyps being considered precursors to CRC. Understanding the molecular mechanisms underlying their development and progression is crucial for improving diagnostic and therapeutic strategies [19]. In doing so, we have identified unique factors that have not received significant attention in existing literature. The detailed exploration of common DEGs, PPIs, and TFs was conducted to emphasize these novel aspects.
In this study, we employed a systems biology approach to investigate the similarities between polyp and CRC at the molecular level. Our analysis of gene expression profiles, PPIs, TFs, and GO revealed valuable insights into the shared molecular features and potential mechanisms underlying these 2 conditions. The identification of common DEGs between polyp and CRC provides important insights into the shared molecular pathways and potential drivers of disease progression. We found a substantial number of common DEGs between the 2 conditions, suggesting shared molecular alterations and dysregulated pathways. These common DEGs may serve as potential biomarkers for early detection, diagnosis, and prognosis of both polyps and CRC. Furthermore, they may represent key molecular players that contribute to the transition from benign polyps to malignant CRC. Interestingly, among the 520 genes commonly dysregulated in both colorectal polyps and CRC, only 8 genes exhibited opposite expression patterns. These genes, namely LY75, SMARCA1, EXOSC7, CYP2A7P1, PAWR, PSIP1, TRACK1, and SPINK4, showed differential expression between the 2 conditions. This observation highlights the complexity and heterogeneity of the molecular alterations occurring during the transition from polyps to CRC. While the majority of the common genes exhibited consistent dysregulation, these 8 genes stood out as unique in their opposing expression patterns. The differential expression of these genes suggests potential divergent roles and molecular mechanisms in the progression of polyps to CRC. While the roles of these specific genes in CRC or colorectal polyps have not been well-established in the available literature, some of them have been studied in other types of cancer and BP.
In bladder cancer, LY75 has been implicated in the regulation of cell function. It has been shown that nitidine chloride, a potential therapeutic agent, can inhibit bladder cancer cell proliferation, migration, and invasion by downregulating the expression of LY75, as well as induce apoptosis and arrest cell cycles [20]. SMARCA1 gene is part of the SWI/SNF chromatin remodeling complex, which plays a role in regulating gene expression. Mutations in SMARCA1 have been investigated in relation to Smith-Fineman-Myers syndrome, a rare genetic disorder [21]. EXOSC7 is known to be a component of the exosome complex, which is involved in the degradation of various types of RNA molecules [22]. CYP2A7P1 gene is a pseudogene of the cytochrome P450 family, which is involved in the metabolism of various endogenous and exogenous compounds [23]. PAWR known as Par-4, this gene has been associated with major depressive disorder. Genetic variations in PAWR have been found to be related to susceptibility to major depressive disorder, but not to the response to antidepressant treatment [24]. PSIP1 encodes a protein that is involved in transcriptional regulation and chromatin remodeling, suggesting potential roles in gene expression regulation [25]. It is important to note that further research is needed to elucidate the specific functions and potential involvement of these genes in CRC and colorectal polyps. The opposite expression of these 8 genes emphasizes the need for comprehensive analyses and further investigations to unravel the complexities of colorectal tumorigenesis. Unraveling the specific roles and interactions of these genes within the context of polyp and CRC development may shed light on the underlying mechanisms and provide valuable insights for future research and therapeutic interventions in CRC.
GO analysis revealed distinct BP associated with the upregulated and downregulated DEGs in polyp and CRC. In CRC, the upregulated genes were enriched in cell adhesion and signal transduction, while the downregulated genes were associated with apoptotic processes and cell division. Similarly, in polyps, the upregulated genes were involved in cell adhesion and cell differentiation, while the downregulated genes were associated with signal transduction and cell division. These findings suggest that dysregulation of these BP may contribute to the pathogenesis of both conditions.
PPI network analysis allowed us to explore the molecular interactions and identify subnetworks associated with specific BP in CRC and polyps. We observed distinct subnetworks related to rRNA processing and positive regulation of cell proliferation in CRC, and mRNA splicing and cell division in polyps. These subnetworks likely play important roles in the molecular mechanisms underlying the progression of polyps to CRC. The identification of hub genes within the PPI networks provides potential targets for further investigation and therapeutic intervention. The analysis of PPI networks revealed several hub genes that play crucial roles in colorectal polyps and CRC. These hub genes, including PIK3R1, FYN, FGFR1, BUB1B, CDC20, CDK1, and CALM1, emerged as highly connected nodes within the networks, suggesting their significance in the molecular processes underlying these conditions. PIK3R1 gene encodes the regulatory subunit of phosphoinositide-3-kinase (PI3K), which is involved in cell growth, proliferation, and survival. Aberrant PIK3R1 expression has been observed in various cancers, including breast cancer and nasopharyngeal carcinoma, where it has been shown to regulate cell proliferation, migration, and invasion [26,27]. FYN is a non-receptor tyrosine kinase involved in various cellular processes, including cell growth, differentiation, and adhesion. In diabetic kidney disease, Fyn has been shown to regulate autophagy through the Fyn-STAT3-VPS34 signaling pathway [28]. Fibroblast growth factor receptor 1 (FGFR1) is a receptor tyrosine kinase involved in cell growth, differentiation, and angiogenesis. Aberrant FGFR1 signaling has been reported in many human cancers, including breast cancer, where it is associated with poor prognosis, shorter overall survival, and resistance to endocrine therapies [29]. BUB1B gene encodes a protein involved in the regulation of cell division and the maintenance of chromosomal stability. Dysregulation of BUB1B has been observed in various cancers, including breast cancer, where it has been shown to be associated with poor prognosis [30]. Cell division cycle 20 (CDC20) functions as a critical cell cycle regulator and has been implicated in cancer development and drug resistance. Elevated CDC20 expression has been detected in various cancers, including breast cancer, kidney cancer, and lung cancer, and has been associated with poor prognosis and increased tumor grade [27]. Cyclin-dependent kinase 1 (CDK1) is a key regulator of cell cycle progression and has been implicated in various cancers. It has been shown to be involved in the regulation of cell proliferation, migration, and invasion in some cancer types [31]. Calmodulin 1 (CALM1) is a calcium-binding protein involved in the regulation of various cellular processes, including cell proliferation, migration, and invasion. It has been implicated in the regulation of cell growth and survival in some cancer types [32].
TF analysis revealed the regulatory relationships between TFs and the DEGs in CRC and polyps. We identified specific TFs that may act as major regulators in each condition, as well as common DE-TFs. Notably, certain TFs exhibited differential expression between CRC and polyps. Among these hub genes, ZNF217, GATA6, and KLF5 were found to be downregulated, while STAT3 and NR3C1 were upregulated. Zinc-finger protein 217 (ZNF217) is thought to be involved in malignant processes in various cancers, such as breast, gastric, colorectal, and prostate cancer. In ovarian cancer, ZNF217 has been shown to play a central role in malignant processes, with silencing of ZNF217 resulting in the effective inhibition of ovarian cancer cell growth and invasiveness [33]. GATA6 is a TF involved in the regulation of cell differentiation and tissue development. In gastric cancer, GATA6 has been shown to cooperate with other TFs, such as KLF5, to promote cancer development [34,35]. In CRC, GATA6 and Krüppel-like factor 5 (KLF5) have been implicated in the regulation of cancer stem cell characteristics and chemoresistance [36,37]. Signal transducer and activator of transcription 3 (STAT3) is a TF involved in various cellular processes, including cell growth, differentiation, and survival. In endometrial cancer, silencing of STAT3 has been shown to inhibit cell proliferation, migration, and invasion, as well as induce cell cycle arrest and apoptosis [38]. Nuclear receptor subfamily 3 group C member 1 (NR3C1) is a nuclear receptor involved in the regulation of various cellular processes, including cell proliferation, differentiation, and apoptosis. In colon cancer, NR3C1 expression has been found to be correlated with miR-200 expression, and this functional relationship might contribute to colon cancer cell survival [39]. In breast cancer, NR3C1 has been implicated in the regulation of cell growth and survival [40]. These TFs may contribute to the dysregulation of gene expression and play crucial roles in the progression of CRC.
Our study represents one of the first comprehensive analyses of the shared molecular features between polyp and CRC using a systems biology approach. By elucidating the molecular similarities between these 2 conditions, our findings contribute to the understanding of the molecular basis of polyp formation and CRC development. The identification of common DEGs, the exploration of PPIs, and the analysis of TFs provide valuable insights into the underlying molecular mechanisms and potential therapeutic targets for further investigation.
In conclusion, our study highlights the importance of systems biology approaches in uncovering the shared molecular features and potential mechanisms underlying polyp and CRC. The identification of common DEGs, the exploration of PPIs, and the analysis of TFs provide a comprehensive view of the molecular landscape of these conditions. These findings pave the way for future research focused on developing personalized therapeutic strategies and improving patient outcomes in both polyp and CRC.
Notes
Funding Source
The authors received no financial support for the research, authorship, and/or publication of this article.
Conflict of Interest
No potential conflict of interest relevant to this article was reported.
Data Availability Statement
Data used in this study is freely available and can be obtained from NCBI using above-mentioned GSE code “GSE41258.”
Author Contributions
Conceptualization: Radak M, Fallahi H. Formal analysis: Radak M. Investigation: Radak M, Fallahi H. Methodology: Radak M. Resources: Fallahi H. Software: Radak M. Supervision; Validation: Fallahi H. Writing - original draft: Radak M. Writing - review & editing: Fallahi H. Approval of final manuscript: all authors.
Supplementary Material
Supplementary materials are available at the Intestinal Research website (https://www.irjournal.org).
Supplementary Table 1.
Common Genes between 2 Diseases Are Listed
Supplementary Table 2.
Genes That Downregulated in Both Diseases
Supplementary Table 3.
Genes That Upregulated in Both Diseases
Supplementary Table 4.
Genes with Different Expression in 2 Diseases