Risk of malignancies and chemopreventive effect of statin, metformin, and aspirin in Korean patients with ulcerative colitis: a nationwide population-based study
Article information

Abstract
Background/Aims
We investigated the incidences of overall and site-specific malignancies and chemopreventive effects of statin, metformin, and aspirin in patients with ulcerative colitis.
Methods
We collected data using the Health Insurance Review and Assessment claims database from January 2007 to April 2020.
Results
The overall malignancy risk among the 35,189 ulcerative colitis patients was similar to that of the general population (standardized incidence ratio, 0.94; 95% confidence interval, 0.88–1.00). In male patients, standardized incidence ratios were high for thyroid cancer and low for stomach cancer, colorectal cancer, liver cancer, and lung cancer. Concurrently, standard incidence ratios were high for liver cancer and central nervous system cancer in female patients. While 122 cases of colorectal cancer occurred in the study patients, the standardized incidence ratio was 0.83 (95% confidence interval, 0.69–0.99). Treatment for ulcerative colitis was not associated with an increased adjusted hazard ratio, while comorbidities increased it for all malignancies. Treatment for ulcerative colitis was associated with an increased adjusted hazard ratio, while comorbidities did not increase it for colorectal cancer. After adjusting for age, sex, comorbidities, and ulcerative colitis treatment, statins showed a dose-dependent chemopreventive effect for all malignancies (P=0.002), while metformin and aspirin did not show any.
Conclusions
In ulcerative colitis patients, standardized incidence ratios for all malignancies and colorectal cancer did not increase. Adjusted hazard ratios for all malignancies increased with comorbidities and those for colorectal cancer with ulcerative colitis treatment. Statins have a dose-dependent chemopreventive effect for all malignancies.
INTRODUCTION
Ulcerative colitis (UC) is a chronic inflammatory disease mainly affecting the colon. The disease has the potential to cause immune-mediated extraintestinal manifestations of organs other than the colon, such as the eye, the joints, the biliary tract, and the skin [1]. Previous studies showed that chronic inflammation contributes to the development of malignancies by promoting genetic and epigenetic aberrations [2]. Likewise, increased incidence of colorectal cancer (CRC) in UC patients has already been reported by several studies [3]. Previous studies have also proven that medications used for the treatment of UC increase the risks of malignancies. Increased risks of lymphoma and skin cancer by the use of thiopurines [4] and anti-tumor necrosis factor-α (anti-TNF-α) agents [5,6] have been noted. Therefore, in UC patients, the risks of malignancies may increase not only due to the disease itself but also its treatment.
Meanwhile, chemopreventive effects of statin, metformin, and aspirin on several malignancies have been demonstrated by several studies. For example, statin showed a dose-dependent chemopreventive effect for hepatocellular carcinoma in patients with chronic hepatitis B [7]. Metformin was reported as an anti-proliferative, chemopreventive and apoptosis-inducing agent in the pathogenesis of CRC [8]. The chemopreventive effect of aspirin in CRC has been more clearly demonstrated and is used in clinical practice [9].
There are limited long-term and large-scale studies evaluating the risks of overall malignancies in UC patients. Moreover, there are also limited studies on chemopreventive effects of statin, metformin, and aspirin for malignancies in UC patients. Therefore, we conducted a nationwide population-based study to investigate incidences of overall and site-specific malignancies and chemopreventive effects of statin, metformin, and aspirin in UC patients.
METHODS
1. Data Sources
The Korean National Health Insurance (NHI) and Health Insurance Review and Assessment Service (HIRA) claim databases were used in this study. The South Korean government operates the NHI system, which functions as a single insurer that provides health insurance to all Koreans. All healthcare utilization information is collected during the reimbursement of healthcare institutions and registered in a comprehensive database operated by the HIRA. The database contains information on demographic characteristics, principal diagnosis and comorbidity (using the 10th International Classification of Disease codes), history of hospitalization and ambulatory care, prescriptions, and medical procedures. As the NHI system covers almost 98% of the total population of South Korea, the data can be regarded as representing the medical characteristics of Koreans [10], and used for political decisions and academic research [11].
Since 2006, the NHI has operated a patient registration system to relieve the financial burden of medical expenses for patients with severe diseases. Several categories of diseases are included in the registration system, including rare intractable diseases (RIDs) and malignancies. Diagnosis of the disease is based on the uniform diagnostic criteria announced by the NHI and carefully reviewed by the healthcare institution and the NHI before registration. Once registered, the patients can benefit from paying only 5% to 10% of their medical expenses as the rest is reimbursed by the NHI [12].
Since 1980, the Korea Central Cancer Registry, established by the Ministry of Health and Welfare, has collected nationwide hospital-based cancer incidence data and provides annual statistics on cancer incidence and survival via the Korean Statistical Information Service (KOSIS) [13].
2. Identification of Incident UC Patients and Follow-up
We identified incident UC patients using the HIRA claims database between January 2008 to April 2019. A year of washout period was set to exclude prevalent cases. Only patients who were followed up for at least 1 year were included for a minimum observation period of outcome occurrence. For more accurate identification of the UC patients, the prescription records of UC medication and diagnostic codes were used in combination. UC patients were defined as those who met all of the following 3 criteria: (1) diagnostic codes for UC (K51.0–51.9) in the principal or subsidiary diagnostic field; (2) RID registration code for UC (V131); and (3) prescription of 5-aminosalicylate suppository or per oral for more than twice and ≥ 30 days [14]. Each participant was followed up to the incidence of cancer or the last follow-up date of the study database (April 30, 2020), whichever came first.
3. Extraction of Covariables from the HIRA Claims Database
Data on baseline demographic characteristics (age, sex, and year at diagnosis of UC) and comorbidities were extracted from the HIRA claims database. Data on prescription records of UC medications, statin, metformin, and aspirin after diagnosis of UC were extracted as well.
The investigated comorbidities and diagnostic codes were as follows: primary sclerosing cholangitis (K83, K87, and V262), hypertension (I10-13, I15), diabetes mellitus (E10-14), coronary vascular disease (I20-25), cerebrovascular disease (I60-69), dyslipidemia (E78) and chronic kidney disease (N18 and dialysis code O701-709) [15]. Comorbidities were investigated at diagnosis of UC and cumulatively assessed during the follow-up period.
Prescription records of UC medications were investigated. To reflect the severity of UC and treatment requirements to control the disease, UC patients were grouped according to the UC treatment at the highest level during the follow-up period. The groups were as follows: (1) 5-aminosalicylate suppository only; (2) 5-aminosalicylate per oral with/without suppository; (3) immunomodulator; (4) one biologics or small molecules; and (5) two or more kinds of biologics or small molecules. Prescription records of UC medications were cumulatively assessed by each year during the follow-up period.
Prescription records of all approved statins (simvastatin, pravastatin, rosuvastatin, atorvastatin, lovastatin, fluvastatin, cerivastatin, and pitavastatin), metformin, and aspirin in a single formulation or a composite formulation with other components were investigated. If prescribed for more than 30 days, the medications were considered used. To evaluate dose-stratified chemopreventive effect of the medications, the patients were grouped according to the duration of prescription during the follow-up period. Prescription records of statins, metformin, and aspirin were cumulatively assessed by each year during the follow-up period. In the study, the minimum exposure-outcome interval between administration of the drugs (statin, metformin, and aspirin) and the occurrence of malignancies was set as 1 year.
In UC patients diagnosed with CRC during the study period, data on year at diagnosis and location of CRC were extracted.
4. Investigation of Cancer Incidence in the General Population and UC Patients
In the general population, incidences were investigated as all malignancies and site-specific malignancies as presented on the KOSIS (Supplementary Table 1). At the time of the study, only incidences from 2008 to 2018 were available on the KOSIS. Therefore, the values of 2019 and 2020 were substituted with the value of 2018 when calculating standardized incidence ratios (SIR).
In the UC cohort defined by the HIRA claims database, incidences of all malignancies and site-specific malignancies after diagnosis of UC were investigated using the same C codes as the KOSIS data and the V193, V194, and V027 codes for RID. Patients with any C codes and V193, V194, and V027 codes during the washout period were considered prevalent malignancy cases and excluded from analyses. When evaluating an incidence of CRC in the UC cohort, patients were censored at the time of colectomy because of reasons other than CRC, such as medically intractable state of UC or toxic megacolon [16].
In the UC cohort, the observation period was separated by calendar year of start and stop, and observed cases were also separated by calendar year of cancer incidence. Sex and agespecific incidences of the same calendar year for malignancies were extracted from the KOSIS data and cumulative sum of observed duration in each UC patient was assessed. To calculate SIR, the number of observed cases in the UC cohort during the study period was divided by the number of expected cases calculated by incidences of the same calendar year in the general population, considering the time trends of the incidences in malignancies [Expected caseTotal = ∑ (Incidence ratecalender year × Observed durationcalender year /100,000)].
5. Statistical Analysis
Categorical and nominal variables were expressed as numbers with percentages, and continuous variables were expressed as medians (interquartile ranges). Cox proportional regression analysis was performed to investigate risk factors associated with outcome events. After evaluating crude hazard ratios (HRs) of independent variables, adjustment for age, sex, comorbidity, and the UC treatment group was performed. All statistical analyses were performed using SAS Enterprise Guide software version 7.1 (SAS Institute Inc., Cary, NC, USA) and SPSS Version 21 (IBM Corp., Armonk, NY, USA). Statistical significance was set at P<0.05.
6. Ethical Considerations
This study was conducted in accordance with the Declaration of Helsinki and its later amendments. All discriminable personal information of the patients was not provided from the HIRA claims database and the KOSIS. The study protocol was approved by the Institutional Review Board (IRB No. HPIRB 2020-06-003-001).
RESULTS
1. Baseline Characteristics
In this nationwide population-based study, 36,289 patients were defined as patients who were newly diagnosed with UC and followed for at least 1 year. After excluding 1,100 patients as prevalent malignancy cases, the remaining 35,189 patients were finally included in the analyses (Fig. 1). Among the study patients, 60.72% were male. The study patients were 41 years (range, 29–54 years) old at diagnosis of UC (Table 1). During the study period, the most common comorbidity was dyslipidemia (58.67%). Cumulative proportion of patients having primary sclerosing cholangitis during the study periods was 3.47% (Table 1).

Patients flow diagram. UC, ulcerative colitis.

Baseline Characteristics of Patients Diagnosed with Ulcerative Colitis
Most of the patients used a 5-aminosalicylate suppository (78.44%) and peroral formula (87.85%). Less than a quarter (24.03%) used immunomodulators, and 11.27% used any kind of biologics or small molecules. The most commonly used biologics or small molecules were infliximab (7.74%) and adalimumab (4.24%). According to the UC treatment group, 73.93% used only 5-aminosalicylates. The proportion of patients who used biologics or small molecules was 11.27%. Among them, 1,086 patients (3.09%) used more than two kinds of biologics or small molecules (Table 1).
About 3 quarters (74.36%) did not use statin, metformin, or aspirin during the study period. Proportions of patients who used statin, metformin, and aspirin were 20.91%, 6.95%, and 9.83%, respectively (Table 1).
2. Incidences of Overall and Site-Specific Malignancies in UC Patients
During the study period, 1,086 patients (3.09%) were identified to be newly diagnosed with some kind of malignancy (610 males and 476 females). Risk for overall malignancies in the UC cohort was similar to that in the general population (SIR, 0.94; 95% confidence interval [CI], 0.88–1.00). According to sex, SIR was slightly higher in female patients (SIR, 1.11; 95% CI, 1.02–1.22) than in male patients (SIR, 0.84; 95% CI, 0.77– 0.91). In male patients, SIRs were high for thyroid cancer (SIR, 1.37; 95% CI, 1.04–1.77) and low for stomach cancer (SIR, 0.49; 95% CI, 0.38–0.63), CRC (SIR, 0.77; 95% CI, 0.61–0.95), liver cancer (SIR, 0.76; 95% CI, 0.58–0.98) and lung cancer (SIR, 0.77; 95% CI, 0.62–0.95). In female patients, SIRs were high for liver cancer (SIR, 1.72; 95% CI, 1.11–2.53) and central nervous system cancer (SIR, 2.49; 95% CI, 1.07–4.90) (Table 2).
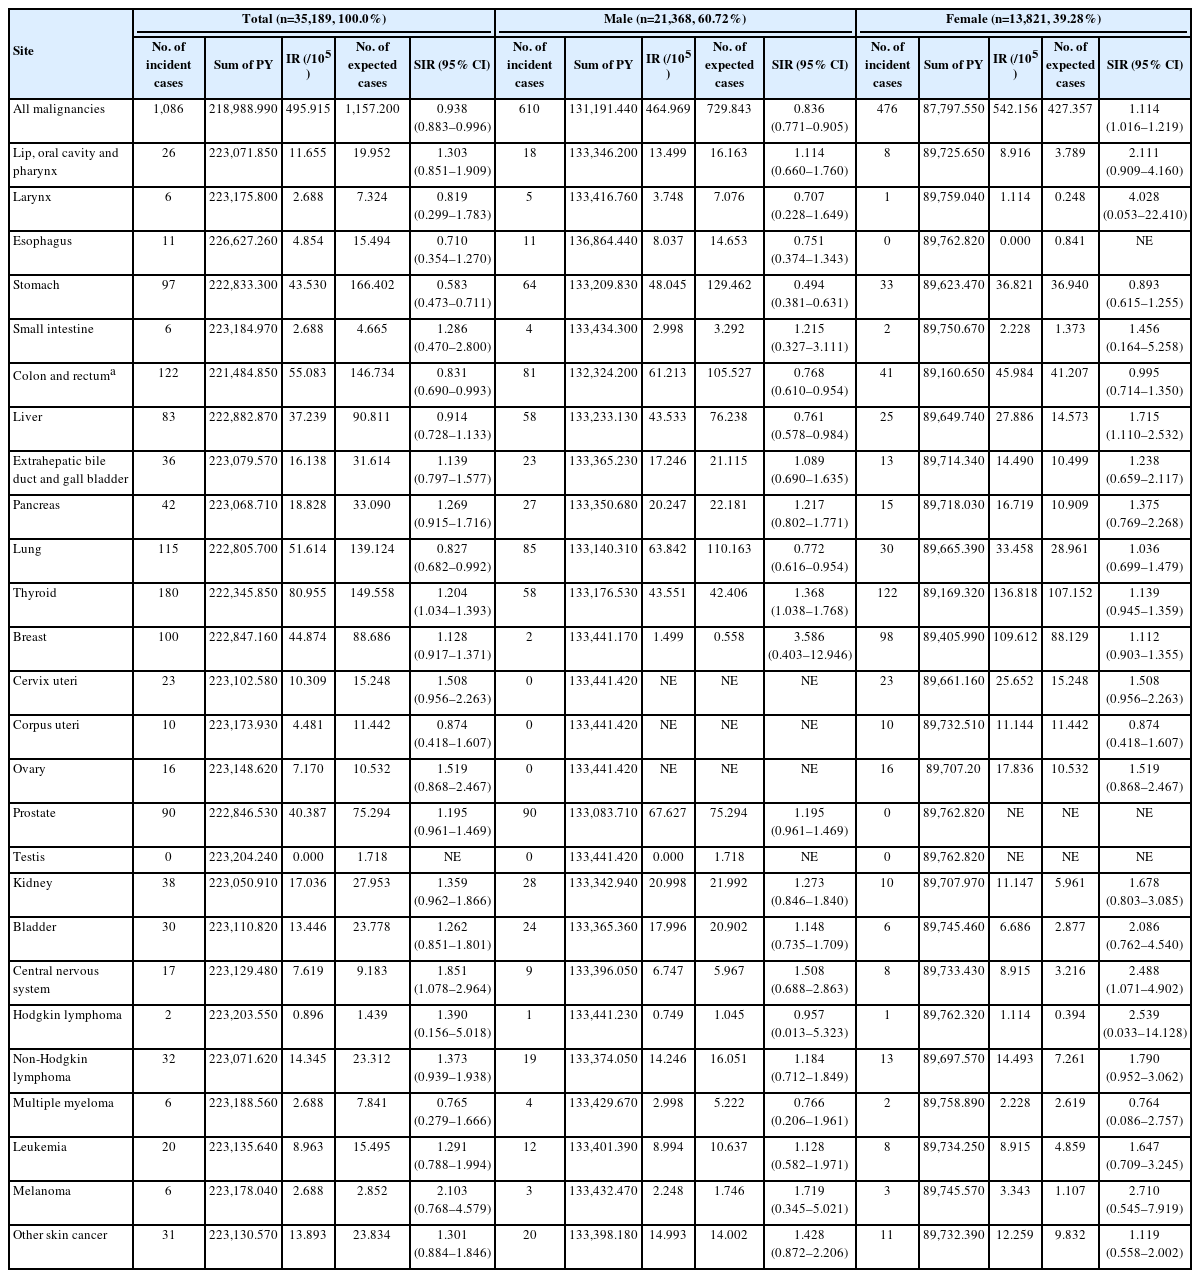
Risk of Site-Specific Malignancies in Patients Diagnosed with Ulcerative Colitis
3. Incidence and Characteristics of CRC in UC Patients
After censoring patients who underwent colectomy because of reasons other than CRC, 122 patients (0.35%) were identified as patients who were newly diagnosed with CRC during the study period (81 males and 41 females). The risk for CRC in the UC cohort was slightly lower than that in the general population (SIR, 0.83; 95% CI, 0.69–0.99). According to sex, SIR was slightly higher in female patients (SIR, 0.99; 95% CI, 0.71–1.35) than in male patients (SIR, 0.77; 95% CI, 0.61–0.95) (Table 2).
Among 122 UC patients and CRC, the median ages at diagnosis of UC and CRC were 50 years (range, 39–64 years) and 55 years (range, 44–66 years), respectively. In UC patients with CRC, the median interval from diagnosis of UC to diagnosis of CRC was 4 years (range, 2–8 years). While the location of CRC was not classifiable in 20.49%, most of the CRCs were located in the rectosigmoid colon (59.01%) (Table 3).

Baseline Characteristics of Patients Diagnosed with Colorectal Cancer and Ulcerative Colitis
4. Risk of All Malignancies and CRC by Comorbidities and UC Treatment
After adjustment with age and sex, hypertension (adjusted HR, 1.242; 95% CI, 1.081–1.428; P=0.002), coronary vascular disease (adjusted HR, 1.240; 95% CI, 1.004–1.530; P=0.046), cerebrovascular disease (adjusted HR, 1.265; 95% CI, 1.017–1.575; P=0.035), dyslipidemia (adjusted HR, 1.161; 95% CI, 1.023–1.319; P=0.021) and chronic kidney disease (adjusted HR, 1.775; 95% CI, 1.155–2.729; P=0.009) were significantly associated with increased HR for all malignancies, while primary sclerosing cholangitis (adjusted HR, 1.615; 95% CI, 0.984–2.650; P=0.058) and diabetes mellitus (adjusted HR, 1.127; 95% CI, 0.964–1.317; P=0.135) were not. For CRC, all investigated comorbidities did not show significant association with increased adjusted HRs (Table 4). The cumulative incidence of CRC in UC patients showed a significant difference between groups according to the age at diagnosis of UC, and the higher the age at diagnosis of UC, the higher the cumulative incidence of CRC (Fig. 2, Supplementary Figs. 1, 2).

Risk of All Malignancies and Colorectal Cancer in Groups by Comorbidities and Ulcerative Colitis Treatment (Adjusted for Age and Sex)

Kaplan-Meier curves for cumulative incidence of colorectal cancer (CRC) by age groups (n=35,189).
The UC treatment groups were significantly associated with increased adjusted HRs for CRC. Moreover, the higher the UC treatment group rank, the greater the increase of adjusted HRs for CRC (P<0.001). When setting the 5-aminosalicylate suppository only group as a reference, adjusted HRs for CRC increased in the 5-aminosalicylate per oral with/without suppository group (adjusted HR, 2.498; 95% CI, 1.092–5.715; P=0.030), immunomodulator group (adjusted HR, 3.452; 95% CI, 1.392–8.558; P=0.008), one biologics or small molecules group (adjusted HR, 4.877; 95% CI, 1.857–12.810; P=0.001) and two or more kinds of biologics or small molecules group (adjusted HR, 13.456; 95% CI, 4.840–37.406; P<0.001) in order. However, the analysis did not show a significant association with increased adjusted HRs for all malignancies with respect to the UC treatment groups (Table 4). The cumulative incidence of CRC in UC patients showed a significant difference between groups according to the UC treatment groups, and the higher the UC treatment groups, the higher the cumulative incidence of CRC (Fig. 3, Supplementary Figs. 3, 4).
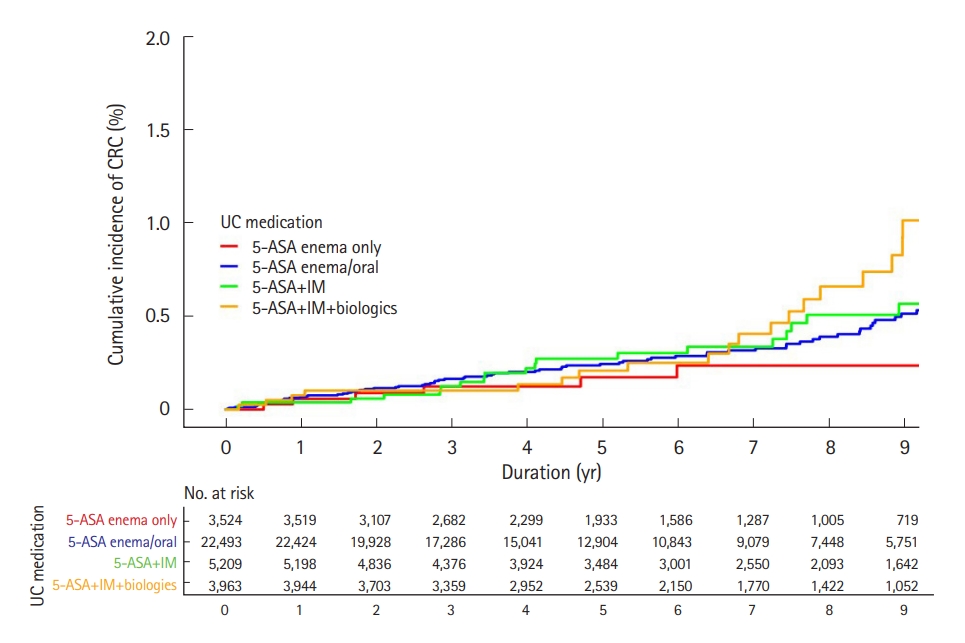
Kaplan-Meier curves for cumulative incidence of colorectal cancer (CRC) by ulcerative colitis treatment groups (n=35,189). 5-ASA, 5-aminosalicylate; IM, immunomodulator.
5. Risk of All Malignancies by Use of Statin, Metformin, and Aspirin in UC Patients
Statin, metformin, and aspirin seemed to have association with increased crude HR for all malignancies. Crude HR for all malignancies in UC patients who used statin was 1.823 (95% CI, 1.590–2.091; P<0.001), and the longer use of statin, the greater increase of crude HRs for all malignancies (P<0.001). For metformin and aspirin use, crude HRs for all malignancies were 1.957 (95% CI, 1.614–2.373; P<0.001) and 2.557 (95% CI, 2.203–2.969; P<0.001), respectively, while they did not increase with the duration of use (P<0.001). However, after adjusting with age, sex, comorbidities, and the UC treatment group, statin (adjusted HR, 0.764; 95% CI, 0.645–0.905; P=0.002) showed chemopreventive effect for all malignancies while metformin and aspirin did not (P>0.05). Adjusted HRs of statin decreased with a longer duration of statin use (P=0.009) (Table 5). Results were similar when analyzed in male UC patients. However, the chemopreventive effect of statin for all malignancies was not documented in female UC patients (Supplementary Tables 2, 3).
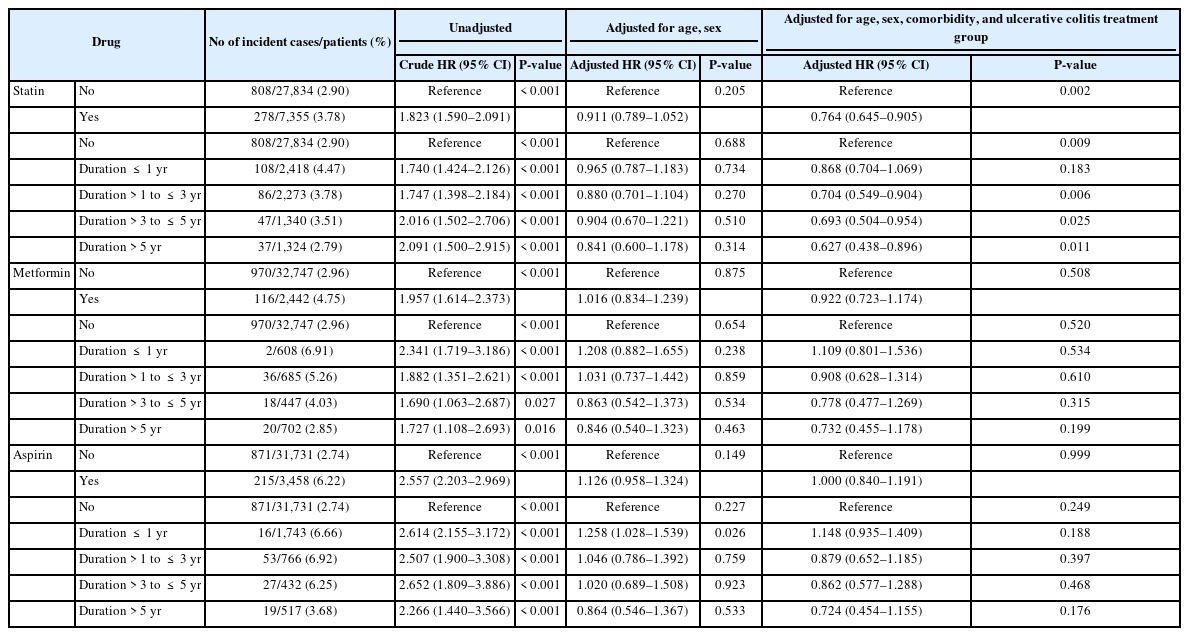
Risk of All Malignancies by use of Statin, Metformin, and Aspirin in Patients Diagnosed with Ulcerative Colitis
6. Risk of CRC by Use of Statin, Metformin, and Aspirin in UC Patients
Crude HRs for CRC in UC patients using statin and metformin did not increase (P>0.05). Aspirin use seemed to be associated with increased crude HR for CRC in UC patients (crude HR, 1.722; 95% CI, 1.044–2.839; P=0.033), and with > 1 year of aspirin use, crude HR was 2.224 (95% CI, 1.192–4.148; P=0.012) with > 1 year of aspirin use. After adjustment with age, sex, comorbidities, and the UC treatment group, all HRs of statin, metformin, and aspirin use became not significant (P>0.05) (Table 6). Results were similar when analyzing by sex (Supplementary Tables 4, 5).

Risk of Colorectal Cancer by Use of Statin, Metformin, and Aspirin in Patients Diagnosed with Ulcerative Colitis
DISCUSSION
This nationwide population-based study aimed to investigate the incidence of overall and site-specific malignancies and chemopreventive effects of statin, metformin, and aspirin in Korean UC patients. Among 35,189 newly diagnosed UC patients, 1,086 patients were diagnosed with malignancies during the 14-year study period. Overall malignancy risk was similar to that of the general population, and SIRs for site-specific malignancies differed by sex. Among the study patients, 122 patients were diagnosed with CRC. Comorbidities were associated with increased adjusted HRs for all malignancies while UC treatments with those for CRC. After adjustment for age, sex, comorbidities, and UC treatment, statin showed dose-dependent chemopreventive effect for all malignancies while metformin and aspirin did not. Regarding CRC, statin, metformin, and aspirin did not have chemopreventive effects in UC patients.
Chronic inflammation is supposed to mediate malignancies by activating transcription factors, thereby transforming a normal cell into a tumor cell [2]. Because of the nature of the disease, the possibility of increased risk for malignancies in UC patients has been brought about [3,17]. Medications for the treatment of UC, such as thiopurines and anti-TNF-α agents, have also been reported to be associated with increased risks of malignancies [4,18,19]. However, several studies showing conflicting results have also been published. According to a European collaborative study, the risk of overall malignancies in inflammatory bowel disease (IBD) patients was comparable to that in the general population [20,21]. A systematic review by Greuter et al. [17] also reported no increased risks of lymphoma and melanoma in patients with IBD. Other studies showed that thiopurines and anti-TNF-α agents did not increase the risk of overall malignancies in patients with IBD [22,23]. In this nationwide population-based study, the risk of overall malignancies in UC patients was similar to that in the general population. SIRs for melanoma, other skin cancer and lymphoma did not increase in both sexes. After adjustment with age and sex, comorbidities related to aging process, such as hypertension, coronary vascular disease and cerebrovascular disease were significantly associated with the increased risk of overall malignancies while the UC treatment groups with immunomodulator or biologics or small molecules were not.
Previous studies have also reported an increased risk of CRC in UC patients and suggested the duration, extent, severity, and young age at diagnosis of UC as risk factors for CRC in UC patients [24]. A meta-analysis by Eaden et al. [25] reported the cumulative incidences as 1.6%, 8.3%, and 18.4% at 10, 20, and 30 years, respectively. They reported that the incidence of CRC in UC patients was 4 to 10 times greater than that of sporadic CRC. However, Söderlund et al. [26] reported the cumulative incidences of CRC as 1.5% and 2.7% at 20 and 30 years, respectively, and a tendency of declining incidences from the 1960s through 2004. A review article by Yashiro [27] and a population-based cohort study from Scandinavia [28] also reported a tendency of decline in the excess risks of CRC in UC patients. In our study, the cumulative incidence of CRC in UC patients was 0.35% during more than 12 years of the study period, which was comparable to that in the general population. Although the presence of metachronous CRC was not evaluable, the location distribution of CRCs in UC patients was similar to that of sporadic CRC [29]. Therefore, in this study, characteristics of CRC in UC patients were similar to that in the general population, except for increasing adjusted HRs according to the level of the UC treatment group, which indirectly reflects cumulative inflammatory burden on the colon in UC patients. Observation period in our study might not be long enough to reflect the risk of CRC by chronic inflammatory insult due to UC as studies reported that the incidence of CRC begins to increase 8–10 years after diagnosis of UC [30]. However, referring to Fig. 3, in severe UC cases using biologics or small molecules the slope of the survival curve of cumulative incidence of CRC increases 8–10 years after UC diagnosis. Therefore, it can be considered that the results are similar to the existing data in UC patients with severe course. Considering that the incidence of sporadic CRC in Korea and many countries has gradually increased recently, which is shown in our data (Supplementary Table 1), the excess risk of CRC in UC might not be significant any longer, except for UC patients with severe disease activity.
In UC patients, colonoscopies are frequently performed for assessing disease activity and surveillance for CRC [31,32]. The role of screening colonoscopy for reducing incidence and mortality of CRC has been proven through several studies in the general population [33]. The effect of surveillance colonoscopy on reducing mortality related to CRC in UC patients has also been documented by previous studies [34]. Therefore, no excessive risk of CRC in UC patients in this study might be partially due to frequent surveillance colonoscopy, as discussed in the previous studies [26,27]. In previous studies, 5-aminosalicylate, steroid, and nonsteroidal anti-inflammatory drugs have been studied as chemopreventive medications in UC patients [34,35]. In our study, all patients used 5-aminosalicylates, which are known to have a chemopreventive effect for CRC in UC patients [36,37]. Moreover, 11.27% used biologics or small molecules, which are known as powerful therapeutics for controlling inflammation in UC patients, thereby reducing the possibility of carcinogenesis of normal colonic cells by chronic inflammatory insult. The chemopreventive effect of 5-aminosalicylate and advancements in treatment strategies might also have contributed to the decrease of CRC in patients with UC.
Several studies have documented the chemopreventive effects of statin, metformin, and aspirin on several malignancies, including sporadic CRC [9,38,39]. While there has been no study evaluating the chemopreventive effects of statin, metformin, and aspirin on malignancies in UC patients, this study evaluated. In this study, statin showed dose-dependent chemopreventive effect for all malignancies while metformin and aspirin did not. However, when analyzing by sex, chemopreventive effect of statin for all malignancies was not documented in female UC patients. Therefore, careful interpretation is needed regarding whether the drug actually lowers the risk. Welldesigned controlled trials are needed to prove the chemopreventive effect of statin in UC patients.
Our study has strengths as we studied the risks of overall malignancies and all kinds of site-specific malignancies in UC patients using long-term and large-scale population-based data. We tried several inclusion and exclusion conditions using the HIRA database for precise and delicate evaluation. In calculating SIR, we used the KOSIS data of the same duration as our study period to reflect yearly trends of incidences of malignancies in the general population.
This study is mainly limited as information on the extent and severity of UC was not available. This limitation is originated from the characteristics of the HIRA claims database, which does not contain results of tests, including colonoscopy. To make up for the shortcomings, we grouped UC patients according to the type of UC treatment at the highest level during the study period and performed stratified analyses. Although information about the time at which specific therapeutics were started in each patient was not included in classifying patients, the groups might reflect cumulative inflammatory burden on the colon of the study patients during the study period, resulting from a combination of severity and extent of inflammation in the colon. Our study results showed the more increased adjusted HRs for CRC in the higher UC treatment groups. Meanwhile, since this is big data using algorithms and it is not possible to review individual patients’ medical records, patients who only used intermittent steroids without using 5-aminosalicylate or immunomodulators/biologics may have been misclassified, even though it is actually a severe case. Also, the start time and the duration of administration of UC medication may have contributed to the occurrence of malignancies but were not included in the analyses.
Moreover, whether the histology indicates a carcinoid tumor or adenocarcinoma is uncertain in patients with C19 codes because of the characteristics of the HIRA claims database, which does not contain histology reports. Also, due to the nature of the big data, whether each patient underwent regular colonoscopy according to the guidelines, which affecting incidence and prognosis of CRC, was not investigated and was not reflected in the analysis. Another limitation could be the possibility of including patients with UC who started immunomodulators, biologics or small molecules for other indications, such as ankylosing spondylitis or psoriasis.
In this study, we concluded that there is no excess risk of overall malignancies and CRC in UC patients compared to the general population. Regarding SIRs for site-specific malignancies which differed by sex, screening for different malignancies should be considered according to sex, which should be supported by further studies. Moreover, well-designed controlled trials are warranted to prove the chemopreventive effect of statin in UC patients.
Notes
Funding Source
This work was supported by research grant from the Korean Society of Gastroenterology.
Conflict of Interest
No potential conflict of interest relevant to this article was reported.
Data Availability Statement
The data underlying this article are available on the following website. Health Insurance Review and Assessment Service (HIRA) claim databases (https://opendata.hira.or.kr/home.do) and The Korean Statistical Information Service databases (https://kosis.kr/index/index.do).
Author Contribution
Conceptualization: Oh EH, Park SH (4th). Data curation: Oh EH, Kim YJ, Kim M. Formal analysis: Oh EH, Kim YJ, Kim M. Project administration: Park SH (6th). Resources: Oh EH, Kim YJ, Kim M. Supervision: Park SH (6th). Writing - original draft: Oh EH. Writing - review & editing: Oh EH, Kim YJ, Park SH (6th). Approval of final manuscript: all authors.
Supplementary Material
Supplementary materials are available at the Intestinal Research website (https://www.irjournal.org).
Supplementary Table 1.
Incidence Rates (/100,000) of Site-Specific Malignancies in the General Population in Korea
Supplementary Table 2.
Risk of All Malignancies by Use of Statin, Metformin, and Aspirin in Male Patients Diagnosed with Ulcerative Colitis
Supplementary Table 3.
Risk of All Malignancies by Use of Statin, Metformin, and Aspirin in Female Patients Diagnosed with Ulcerative Colitis
Supplementary Table 4.
Risk of Colorectal Cancer by Use of Statin, Metformin, and Aspirin in Male Patients Diagnosed with Ulcerative Colitis
Supplementary Table 5.
Risk of Colorectal Cancer by Use of Statin, Metformin, and Aspirin in Female Patients Diagnosed with Ulcerative Colitis
Supplementary Fig. 1.
Kaplan-Meier curves for cumulative incidence of colorectal cancer (CRC) by age groups in male patients (n = 21,368).
Supplementary Fig. 2.
Kaplan-Meier curves for cumulative incidence of colorectal cancer (CRC) by age groups in female patients (n = 13,821).
Supplementary Fig. 3.
Kaplan-Meier curves for cumulative incidence of colorectal cancer (CRC) by ulcerative colitis treatment groups in male patients (n = 21,368). 5-ASA, 5-aminosalicylate; IM, immunomodulator.
Supplementary Fig. 4.
Kaplan-Meier curves for cumulative incidence of colorectal cancer (CRC) by ulcerative colitis treatment groups in female patients (n = 13,821). 5-ASA, 5-aminosalicylate; IM, immunomodulator.