


INTRODUCTION
Mucosal abnormalities and molecular changes associated with colorectal adenomas have been reported since colonoscopy began to be widely used for the screening of colorectal cancer.1,2,3 However, the clinical significance of colonic mucosal abnormalities on endoscopy is still unknown. Among the endoscopic mucosal abnormalities in the colon, chicken skin mucosa (CSM) was first identified in 1998 and was described with specific morphologic changes surrounding a colorectal adenoma.4 CSM is a pale yellow-speckled pattern of colonic mucosa on endoscopy; lipid-filled macrophages in the lamina propria are noted on histopathology. Previous findings might have suggested presence of colonic xanthoma in CSM1,3,5,6,7 but CSM demonstrates distinct features that only occur adjacent to colorectal neoplasms.4
Previous studies suggested that CSM was caused by colonic intestinal metaplasia, toxic factors from damaged intraluminal mucosa, or a sign of previous mild damage.4,8,9 In children, CSM was associated with juvenile polyps, which is not a precancerous condition, and immunostaining for Ki-67 and p53 was not increased.10,11 CSM-positive juvenile polyps were larger than CSM-negative juvenile polyps in children, probably because of local mucosal damage rather than preneoplastic lesions.10 However, a recent study showed that colorectal neoplasm with CSM was associated with increased risk of carcinogenesis.12 Colorectal adenomas with CSM in adults demonstrated higher Ki-67 and COX-2 expression as markers of cell proliferation and lower caspase-3 expression as a marker of apoptosis compared to colorectal adenoma without CSM.12 In addition, the prevalence of CSM was higher in carcinoma patients (64.3%) than in adenoma patients (22.1%). Therefore, it is still unclear whether CSM is associated with carcinogenetic process or is only a trauma-related mucosal change.
We evaluated the prevalence and clinical characteristics of patients with CSM, and whether CSM is a useful predictor of advanced colorectal adenoma. We also assessed the association between the existence of CSM and other risk factors for colorectal adenoma.
METHODS
1. Subjects
This cross-sectional study was conducted using a prospective registry of health check-up participants who underwent endoscopic mucosal resection (EMR) of colonic adenomas at the Asan Health Screening and Promotion Center between June 2009 and December 2011 following a screening colonoscopy. Patients who received a forceps biopsy of small polyps to avoid pathologic misdiagnosis and those with a prior history of colorectal cancer or IBD were excluded. All screened patients received details of the screening program in written, and a standard questionnaire related to their personal medical history, present medications, family history, and lifestyle. Physical examinations, laboratory assays, imaging studies, and endoscopies were performed after fasting for >12 hours on the day of examination. We retrospectively reviewed these laboratory findings and questionnaires, which was approved by the Asan Medical Center institutional review board.
2. Colonoscopy and EMR
The bowel was prepared using 4 L of polyethylene glycol solution. All examinations were performed by experienced colonoscopists using high-definition colonoscopy (CFH60AI®; Olympus, Tokyo, Japan). During colonoscopy, the location, the number, and the size of polyps (estimated using the opened biopsy forceps) were recorded, and photos were taken of ≥10 colon landmarks (terminal ileum, ileocecal valve, cecum, ascending colon, hepatic flexure, transverse colon, splenic flexure, descending colon, sigmoid colon, and rectum). When a polyp was found, pictures were taken at close range and the distant view during endoscopy to identify the characteristics of polyps. EMR was performed in cases of a polyp size >5 mm or unresected adenoma during screening colonoscopy. All resected polyps were retrieved and reviewed by expert gastrointestinal pathologists, according to the Vienna classification.13 The diagnosis of CSM was determined by reviewing the colonoscopy images. Two blinded expert colonoscopists reviewed the colonoscopic findings by accessing the characteristics of the patients and the pathologic reports of polyps. Inter-observer variation was measured by Kappa statistic and the value was 0.629.14 For the patients with multiple colorectal adenomas associated with CSM, the most advanced lesion was used for the classification of the subjects.
3. Definition of Terms Used in This Study
The locations of colonic polyps were divided into the proximal colon (cecum, ascending colon, hepatic flexure, and transverse colon) and the distal colon (splenic flexure, descending colon, sigmoid colon, and rectum). Advanced pathology meant a colonic adenoma with >25% villous structure, high-grade dysplasia, or carcinoma in situ.
4. Statistical Analysis
The relationship between the presence of CSM, clinical factors, and the characteristics of the colonic adenomas was analyzed using the χ2 test, whereas continuous variables were examined using the Student t-test. Logistic regression model was used to investigate the relationship between the advanced adenoma and the existence of CSM. Two-tailed P-values <0.05 was considered statistically significant. The Statistical Package for the Social Sciences version 21.0 (SPSS Inc.,Chicago, IL, USA) was used for all analyses.
RESULTS
1. Baseline Characteristics of the Study Population
A total of 753 patients were eligible for inclusion. Of these, 20 patients were excluded in the final analysis because of a prior history of colorectal cancer (n=3) or an incomplete questionnaire (n=17). The mean age of the enrolled 733 patients was 56.5±8.5 years; 563 patients (76.8%) were men (Table 1). The mean number of adenomas per patient was 2.6±2.0, with a median size of 9 mm (range=4-30 mm). The number of adenomas was represented as the sum of found polyps during initial colonoscopy and polypectomy. Among endoscopically resected adenomas, 90.5% were tubular adenomas (n=663), 4.9% were villous adenomas (n=36), and 4.6% were high-grade dysplasia (n=24) (Table 2).
2. Clinical Characteristics of the Patients With CSM-Surrounding Adenoma
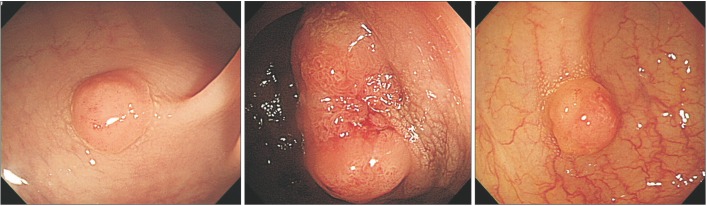
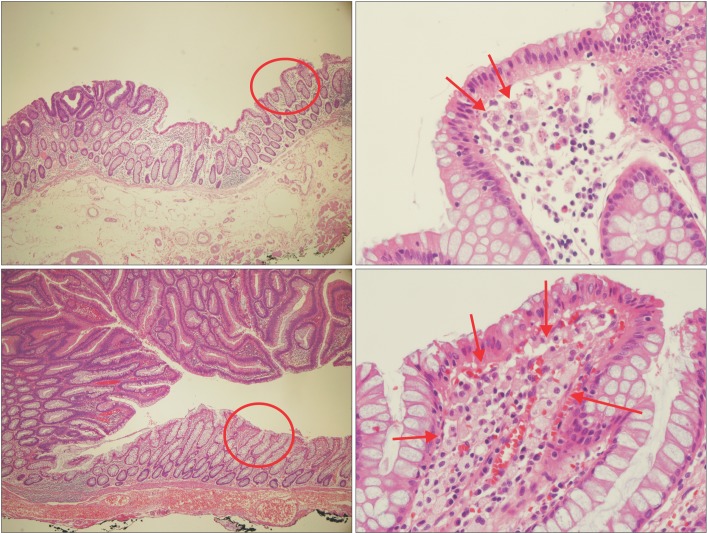
Of all 733 patients, 225 (30.7%) had CSM surrounding the adenoma in the colon. CSM adjacent to colorectal adenomas demonstrated tiny yellow speckles around adenoma (Fig. 1). H&E CSM demonstrated foamy macrophages in the lamina propria (Fig. 2). Patients with CSM were younger than those without CSM (54.9±8.7 years vs. 57.1±8.3 years, respectively; P=0.001). However, there were no significant differences in terms of BMI, smoking status, alcohol consumption, family history of colorectal cancer, metabolic syndrome, or the levels of total cholesterol, fasting glucose, triglyceride, or insulin.
3. Association Between Characteristics of Adenoma and Existence of CSM
The prevalence of high-grade dysplasia and carcinoma in situ was significantly higher in adenoma with CSM than without CSM (7.1% vs. 3.5%, respectively; P=0.003). The advance pathology (e.g., villous adenoma, high-grade dysplasia, or carcinoma) was significantly associated with the presence of CSM (15.1% in the adenomas with CSM vs. 7.1% without CSM; P=0.001). The presence of CSM was associated with adenoma multiplicity. The mean number of adenomas was 2.9±2.3 in patients with CSM and 2.5±1.9 in patients without CSM (P=0.017). The prevalence of multiple adenomas (≥2 adenomas per patient) was also higher in patients with CSM than in patients without CSM (P=0.004). CSM-related adenomas were frequently observed in the distal colon (93.3%) and in protruding type adenomas (72.9%). However, the median adenoma size was not associated with the presence of CSM (Table 2).
4. Multivariable Analysis of Association Between Adenoma and CSM
In univariate logistic regression, CSM-related adenomas were associated with younger age (OR, 0.969; 95% CI, 0.951-0.988; P=0.001), multiple adenomas (OR, 1.693; 95% CI, 1.186-2.418; P=0.004), protruding morphology (OR, 1.606; 95% CI, 1.138-2.267; P=0.007), and advanced pathology (OR, 2.334; 95% CI, 1.419-3.840; P=0.001). In multivariate logistic regression, CSM-related adenoma was associated with younger age (OR, 0.960; 95% CI, 0.937-0.983; P=0.001), multiple adenomas (OR, 1.692; 95% CI, 1.143-2.507; P=0.009), protruding morphology (OR, 1.493; 95% CI, 1.027-2.170; P=0.036), and advanced pathology (OR, 2.078; 95% CI, 1.191-3.627; P=0.010) (Table 3).
5. Distribution of Lipid-Laden Macrophage Infiltration According to Pathology
CSM is an aggregation of a large number of lipid-laden macrophages in the colorectal mucosa. Although we mostly use endoscopic images to detect CSM, we examined the distribution of lipid-laden macrophages in several cases after EMR. CSM with adenocarcinoma or high-grade dysplasia exhibited higher infiltration of lipid-laden macrophages in the lamina propria than CSM with tubular adenoma (Fig. 2). These findings are considerably equivalent with macroscopic view of CSM (Fig. 1).
DISCUSSION
CSM frequently surrounds polyps in the distal colon and rectum; however, its clinical prevalence remains unknown owing to inadequate research in this area. Our data showed that 30.7% of patients with colorectal adenoma or carcinoma demonstrated CSM. Advanced pathology (i.e. villous adenoma, dysplasia, and carcinoma) and multiplicity of adenoma were found to be associated with CSM. Patients with CSM also demonstrated a higher prevalence of synchronized polyps in both the distal and proximal colon compared to patients without CSM (50.6% vs. 35.2%, P<0.001). Synchronous adenomas are high risk group for the development of advanced adenomas and cancer.15,16 The presence of distal polyps was helpful to predict advanced proximal neoplasia in asymptomatic old patients, and more careful examination is required in patients with distal polyps with CSM.17
Our previous study revealed that a Western-style diet promotes colon carcinogenesis by recruiting macrophages in a mouse model.18 The risk factors for colorectal cancer include visceral obesity, metabolic syndrome, age >60 years, advanced pathology, and IBD.19,20,21 As per our current study, the presence of CSM is not associated with obesity, old age, metabolic syndrome, or other risk factors, and may be an independent endoscopic entity.
CSM with adenocarcinoma or high-grade dysplasia exhibited much higher infiltration of lipid-laden macrophages than CSM with tubular adenoma in the lamina propria (Fig. 2). Macrophages are key players in the inflammatory response, and the connection between chronic inflammation and tumorigenesis is well established. The number of mucosal macrophages appears to be correlated with the relative bacterial load, and their numbers decrease in the intestine of germ-free mice.22 The inflammatory microenvironment is important for cancer development, and tumor-associated macrophages (TAM) exert pro-tumor functions in this microenvironment.23 TAM promotes the growth, angiogenesis, and metastasis of various cancers by releasing growth factors, cytokines, chemokines, and enzymes. The endoscopic features of CSM surrounding adenoma coincide with the infiltration of lipid-laden macrophages. It is unclear whether the macrophages are TAM, because macrophages in CSM reside in normal mucosa surrounding tumor; however, TAM are found in the stroma of tumors.24 Therefore, it is supposed that lipid-laden macrophages move towards the tumor and infiltrate the area around it. This phenomenon may express the extent of inflammatory activity and carcinogenetic progression of the tumor. Most adenomas with CSM in our present study were located in the sigmoid colon or rectum. Distal colon and rectum might have more chance of bowel inflammation by retaining stool, bacteria, and macrophages. A recent study reported that high numbers of macrophage population located in the spleen as an extra-medullary site.25 These findings support why CSM is mostly found in the distal colon, even though macrophages are widely distributed.
Previous data indicated that adenocarcinomas and colorectal adenomas with CSM expressed similar levels of Ki-67 and COX-2 proteins; survivin and caspase-3, key regulators of apoptosis, were suppressed in colorectal adenomas with CSM.12 Although these findings have important implications that the occurrence of colorectal cancer is associated with apoptosis, the sample size of the study was small and the clinical characteristics of the CSM patients were poorly characterized. It is uncertain whether CSM surrounding adult colorectal adenoma is a risk factor for colon carcinogenesis. CSM with juvenile polyps in children is suggested as the result of local mucosal trauma indicating that it is not a precursor to dysplasia,26 although CSM-positive polyps are larger than CSM-negative polyps. However, this finding is debatable because juvenile polyps are hamartomatous and post surveillance was not performed.
Our current study has limitations considering that small and minute-sized polyps were not analyzed. In addition, we could not test all samples of CSM around polyps owing to the retrospective nature of the study. Further biological experiments and prospective studies are needed to determine if the CSM is indeed a predictive marker of colorectal cancer development. Nevertheless, the current study is, to our knowledge, the first to report the prevalence and clinical characteristics of colorectal neoplasms with CSM found in the screening field. Detection of advanced neoplasia is very important to determine the interval of surveillance colonoscopy27 and CSM may provide important information for post-polypectomy surveillance.
In conclusion, the present retrospective analyses showed that CSM was associated with tumor multiplicity and advanced histology in distally located colon adenomas. Obesity, metabolic syndrome, and old age were not associated with CSM. It is uncertain whether CSM surrounding colorectal adenoma is a risk factor for colon carcinogenesis; however, CSM is a distinctive marker of advanced pathology of colorectal adenoma. It can provide valuable insights for future research in this area and for planning post-polypectomy surveillance.