


THE ROLE OF CROSS-SECTION IMAGING TO DIFFERENTIATE INFLAMMATORY FROM FIBROTIC COMPONENT
1. Clinical Relevance of Differentiating Inflammatory from Fibrotic Component
The development of an intestinal stricture in patients with CD represents an important event on the natural history of these patients that threatens an increased risk of surgery [1-3].
Up to 10% of patients with CD present with a stricture at diagnosis and up to half of patients will progress to a stricturing phenotype during their life [4,5].
The mechanisms by which strictures develop in CD are complex. The most accepted hypothesis is that excessive repair response to bowel inflammation causes a reduction in luminal diameter, which is dependent on both the pleiotropic actions of inflammatory mediators and the interplay of profibrotic genetic, cellular, and microbiota-related factors [6]. This interaction, therefore would explain the overlap between both inflammatory and fibrotic components reported on several publications [7-15].
The accurate determination of the extent of fibrosis in involved bowel segments is important for various reasons. In clinical practice, it is essential to differentiate between strictures that are predominantly due to fibrosis and those that are predominantly due to inflammation, because fibrotic strictures require endoscopic balloon dilation or surgery, but predominantly inflammatory strictures may benefit from anti-inflammatory treatment. This differentiation could also help us to understand the role of fibrosis in symptoms in the absence of inflammation. Finally, the accurate measurement of fibrosis is essential for the development and testing of drugs to prevent and treat strictures due to fibrosis [16]. Such drugs would be a great step forward in the management of CD, as currently available treatments all primarily aim to reduce inflammation rather than fibrosis [17].
Endoscopic biopsies are unable to measure the amount of fibrosis in the intestinal wall. Cross-sectional imaging modalities can identify strictures in both the small and large bowel, and given the transmural nature of CD, enable a more objective assessment including the differentiation between inflammation and fibrosis.
2. Potential Contribution of Cross-Sectional Imaging
In recent years, various cross-sectional imaging techniques have been incorporated into daily practice and research to better characterize bowel strictures and to quantify the degree of fibrosis. Although the evidence on the utility of these techniques is still weak, in the near future, they may provide information critical for planning therapeutic management [18,19].
Cross-sectional imaging is highly accurate in detecting inflammatory lesions [18,19]. One key feature indicating the presence of active disease is mural hyperenhancement on a thickened bowel segment. When evidence of mural hyperenhancement, edema, or hypervascularity is lacking on cross-sectional imaging of the bowel, fibrosis is often assumed. However, fibrosis is closely linked to inflammation, and both components are frequently superimposed in stenotic segments [6]; therefore, standard imaging modalities might be unable to differentiate between fibrosis and inflammation [8-10,13]. Some studies based on conventional morphologic and/or non-dynamic contrast-enhanced imaging features on the bowel were unable to detect or quantify the amount of fibrosis in the bowel beyond identifying strictures with proximal dilation [7] and others reported conflicting results [9,11].
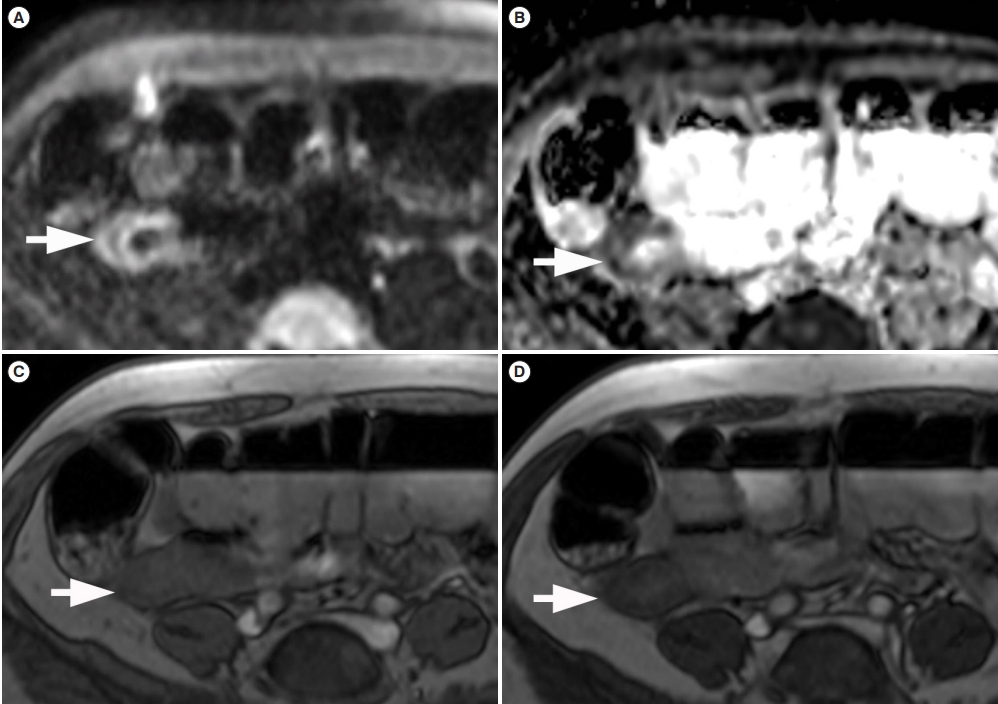
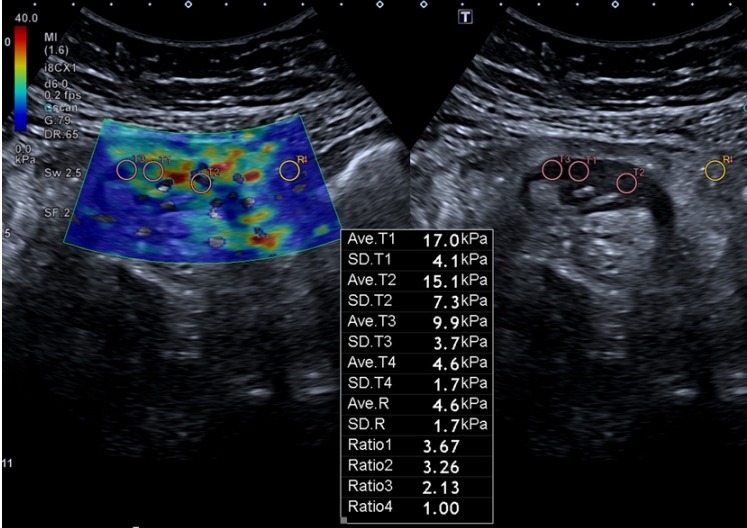
Evidence from more recent studies indicates that new imaging techniques are being developed including diffusion-weighted imaging, dynamic contrast-enhanced MRI, magnetization transfer (Fig. 1) or shear-wave and strain-wave ultrasound elastography (Fig. 2) promise to improve the quantification of bowel wall fibrosis [20]. Table 1 summarizes the main characteristics of novel imaging modalities that had been investigated to detect and quantify fibrosis in CD, whereas Table 2 provides the evidence obtained in studies testing the techniques against histopathology [9-11,13-15,21-25]. To date, all the evidence comes from single-center studies with relatively small samples. Before these noninvasive quantitative imaging biomarkers can be widely implemented, further multicenter large-scale studies are needed to establish cutoff values, test their reproducibility, and determine their degree of interobserver agreement.
CONCLUSION
Differentiation between fibrotic and inflammatory strictures remains a crucial challenge in the management of CD. There is currently no standardized approach to determine whether intestinal strictures are predominantly due to fibrosis or inflammation. The frequent superimposition between inflammatory and the fibrotic component in stenotic segments hampers its proper characterization. Traditional cross-sectional imaging modalities were unable to detect fibrosis, but recent studies using elastography and advanced MRI techniques such as diffusion-weighted imaging and magnetization transfer sequences have reported interesting findings that promise to improve the detection and grading of fibrosis in CD. Before these techniques can be fully incorporated into routine practice, however, further studies are necessary to establish cutoff values, test their reproducibility, and determine the interobserver agreement.