


INTRODUCTION
Crohn’s disease (CD) is characterized by unpredictable phases of relapse and remission with a progressive disease course [1,2]. Traditionally, symptom-based clinical indices along with endoscopy and imaging have been used to monitor disease activity, providing a rationale to start or change treatment. In the past several decades, an array of noninvasive stool or serum markers have emerged to monitor disease activity or to predict relapse of disease. Notably, fecal calprotectin (FC) has been intensively investigated in the past decade. Calprotectin is a 36 kDa S100 family calcium-binding protein that is released largely from granulocytes, monocytes, and epithelial cells [3,4]. The concentration in stool can be used to discriminate inflammatory bowel disease (IBD) from irritable bowel syndrome [5,6], reflect the degree of inflammation in established IBD [7,8], and predict clinical relapse [9-13].
Recently, S100A12, another S100 family protein, has been reported for its potential as a noninvasive marker in IBD. In contrast to calprotectin, it binds to a receptor for advanced glycation end products and is predominantly released from granulocytes [4]. Studies have suggested that fecal S100A12 (FS) may be a more specific marker for intestinal inflammation and can be superior to FC in discriminating IBD from irritable bowel syndrome [4,14,15]. However, evidence of the predictive role of FS for future clinical outcomes in IBD is scarce. Only 1 study investigated its association with clinical relapse [16] and another study reported its association with a response to anti-tumor necrosis factor (TNF) agents among patients with CD [17]. Importantly, these studies have been limited to CD patients from North America and Europe with lack of evidence in other regions.
Therefore, we conducted a real-world prospective pilot study to evaluate whether FS and serum S100A12 (SS) levels are associated with poor future outcomes including clinical relapse, CD-related hospitalization, step-up of medical treatment, and future intestinal resection in patients with clinically quiescent CD. Additionally, we assessed the correlation between FS and SS with clinical activity index and other serum inflammatory markers.
METHODS
1. Study Design and Patients
Patients with CD in clinical remission for the past 6 months were prospectively enrolled from June 2012 to March 2013. These patients were followed until March 2017. All patients were of Korean descent and were recruited at Asan Medical Center, a tertiary care center in Seoul, Korea. Diagnosis of CD was made based on the clinical, radiological, endoscopic and histological criteria [18]. Clinical remission was defined as a Crohn’s Disease Activity Index (CDAI) score less than 150 [19]. Exclusion criteria were as follows; use of corticosteroids or nonsteroidal anti-inflammatory drugs or antibiotics within the past 6 months, presence of stoma (previous formation of ileostomy or colostomy), pregnancy, and other severe comorbidities.
At study enrollment, both fecal and serum samples were collected. Patients were followed routinely at the outpatient clinic every 1-3 months at the physician’s discretion depending on the severity of the disease. Patients were followed until (1) loss to follow-up; or (2) end of follow-up (March 2017). At each clinic visit, patients were monitored by the CDAI score and blood laboratory tests including complete blood count, chemistry, erythrocyte sedimentation rate (ESR), and C-reactive protein (CRP). To calculate the CDAI score at each visit, patients were required to record their bowel frequency, abdominal pain, and general well-being state for 7 days before each visit [19]. The CDAI score was generated automatically by a computerized program and incorporated into the electronic medical records system, based on the patient’s daily symptom records, height, weight, physician’s examination, and blood test at each visit. Written informed consent was obtained from all study subjects. The study protocol was approved by the Institutional Review Board (IRB) of Asan Medical Center (IRB No. 2010-0774).
2. Assessment of Disease Activity and Clinical Outcomes
At enrollment, the following clinical data were collected: age at enrollment, age at CD diagnosis, sex, smoking status, disease location and behavior based on Montreal classification [20], previous use of 5-aminosalicylic acid (5-ASA), thiopurines, and biologics. At the time of the study design, only anti-TNF agent (infliximab) was approved as a biologic agent for clinical use for patients with CD in Korea.
The following clinical outcomes were investigated: clinical relapse, CD-related hospitalization, step-up of medical treatment, and CD-related intestinal resection. Clinical relapse was defined as CDAI > 220, or 2 consecutive levels of CDAI 150-220 with an increase of more than 70 from the index CDAI. Index CDAI refers to the CDAI score on the day of enrollment. CD-related intestinal resection was defined as any bowel resection surgeries related to CD. Step-up of medical treatment was defined as starting thiopurine agents (azathioprine/6 mercaptopurine) or an anti-TNF agent in thiopurine or anti-TNF-naïve patients or the use of rescue systemic corticosteroids in case of a CD flare. CD-related hospitalization was defined as any hospitalization related to CD for at least 48 hours of hospital stay.
3. Fecal and Serum S100 Proteins
All patients provided a single stool sample and blood sample at enrollment which were transported directly to the laboratory. One hundred mg of stool sample was homogenized after suspension in the extraction buffer (1:50). The supernatant was stored at -70°C. FS, FC and SS were measured using the enzyme-linked immunosorbent assay kits (Alpco, Salem, NH, USA and Calpro AS, Oslo, Norway, respectively). The assay readers were blinded to the clinical data of study subjects. FS, FC, and SS levels were measured 2 times consecutively and the mean level was used for analysis. Notably, the treating physicians were blinded to these levels.
4. Statistical Analysis
Continuous variables were presented as medians and interquartile ranges (IQRs) and categorical variables were expressed as numbers and percentages. Spearman rank-order correlation test was used to assess the correlation between 2 continuous variables. Univariable and multivariable Cox proportional hazards regression was used to assess the association between baseline variables and time-to-clinical outcomes. Time was right censored for each outcome with the earliest time point among the following: (1) time of the event (clinical outcomes); (2) time of follow-up loss; (3) time at the end of follow-up. Kaplan-Meier curves were generated to compare 2 groups based on a dichotomized variable. For comparability of the effect size between the variables of interest in the time to event analyses, the continuous variable was dichotomized as the top quartile versus the rest. Concordance index (c-index) indicated the predictive ability for prospective outcomes. A Pvalue < 0.05 was considered statistically significant. Statistical analyses were performed by R version 4.0.3 (R Foundation for Statistical Computing, Vienna, Austria).
Notably, this study was an exploratory pilot study for assessing the performance of FS on future clinical outcomes in Korean CD patients; no previous study had explored FS for various clinical outcomes in the Asian population with CD when the study was designed. Post-hoc power calculation was performed for future studies based on the results from this study.
RESULTS
1. Baseline Characteristics of Study Patients
A total of 54 patients were screened; 1 patient was not eligible, 1 patient withdrew the informed consent and 3 patients violated the study protocol. Therefore, a total of 49 patients were finally enrolled in the study, of whom 38 (77.6%) were males and the median age was 30.3 years (IQR, 23.7-37.8) (Table 1). The median duration of disease was 4.2 years (IQR, 2.9-5.6). The majority of patients had ileocolonic disease (L3, 31 patients, 63.3%) and non-stricturing, non-penetrating behavior (B1, 30 patients, 61.2%) at enrollment. Eight patients (16.3%) were on anti-TNF agents, 34 (69.4%) were on thiopurines with oral 5-ASA agents, 6 (12.2%) were on thiopurines alone, 8 (16.3%) were on oral 5-ASA agents alone.
The median FS and FC levels at baseline were 0.042 mg/kg (IQR, 0.005-0.179) and 486.8 mg/kg (IQR, 203.5-886.8), respectively. The median SS level was 1,398.2 ng/mL (IQR, 791.8-2,759.9). Notably, two-thirds (66.7%) had a FC level over 250 mg/kg, despite a normal CDAI score for the past 6 months. The median CDAI was 42.8 (IQR, 20.7-74.1) at enrollment. All patients were followed for at least 1 year with a median follow-up duration of 4.4 years (IQR, 4.3-4.5). Baseline demographics and laboratory test results are presented in Table 1.
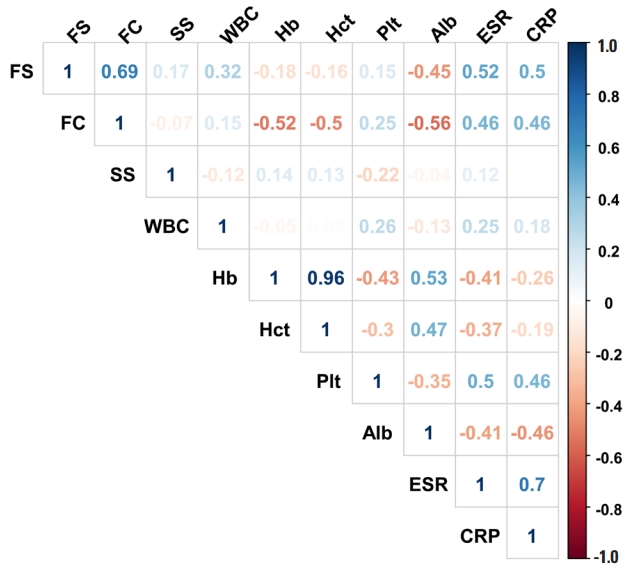
2. Correlation between Baseline S100 Protein Markers, CDAI Score and, Serum Inflammatory Markers
FS significantly correlated with FC (r= 0.689, P< 0.001), while it did not correlate with SS (r= 0.168, P= 0.248). In addition, FS significantly correlated with the following inflammatory markers: ESR (r= 0.524, P< 0.001), CRP (r= 0.499, P< 0.001) and serum albumin (r= -0.446, P= 0.001). Similarly, FC significantly correlated with the following markers: serum albumin (r = -0.562, P< 0.001), hemoglobin (r = -0.522, P< 0.001), ESR (r = 0.465, P= 0.001), and CRP (r= 0.459, P= 0.001). Of note, both FS and FC lacked correlation with the CDAI score (r=0.045, P= 0.757; r= 0.259, P= 0.072). Results of correlation analyses are represented in Fig. 1.
Based on a subgroup analysis in our study, the correlation between FS and FC was numerically stronger in patients with colonic/ileocolonic disease (L2/L3) (r= 0.736, P< 0.001) compared to those with an isolated ileal disease (L1) (r = 0.390, P= 0.151).
3. Association of Baseline S100 Protein Levels with Time to Clinical Outcomes
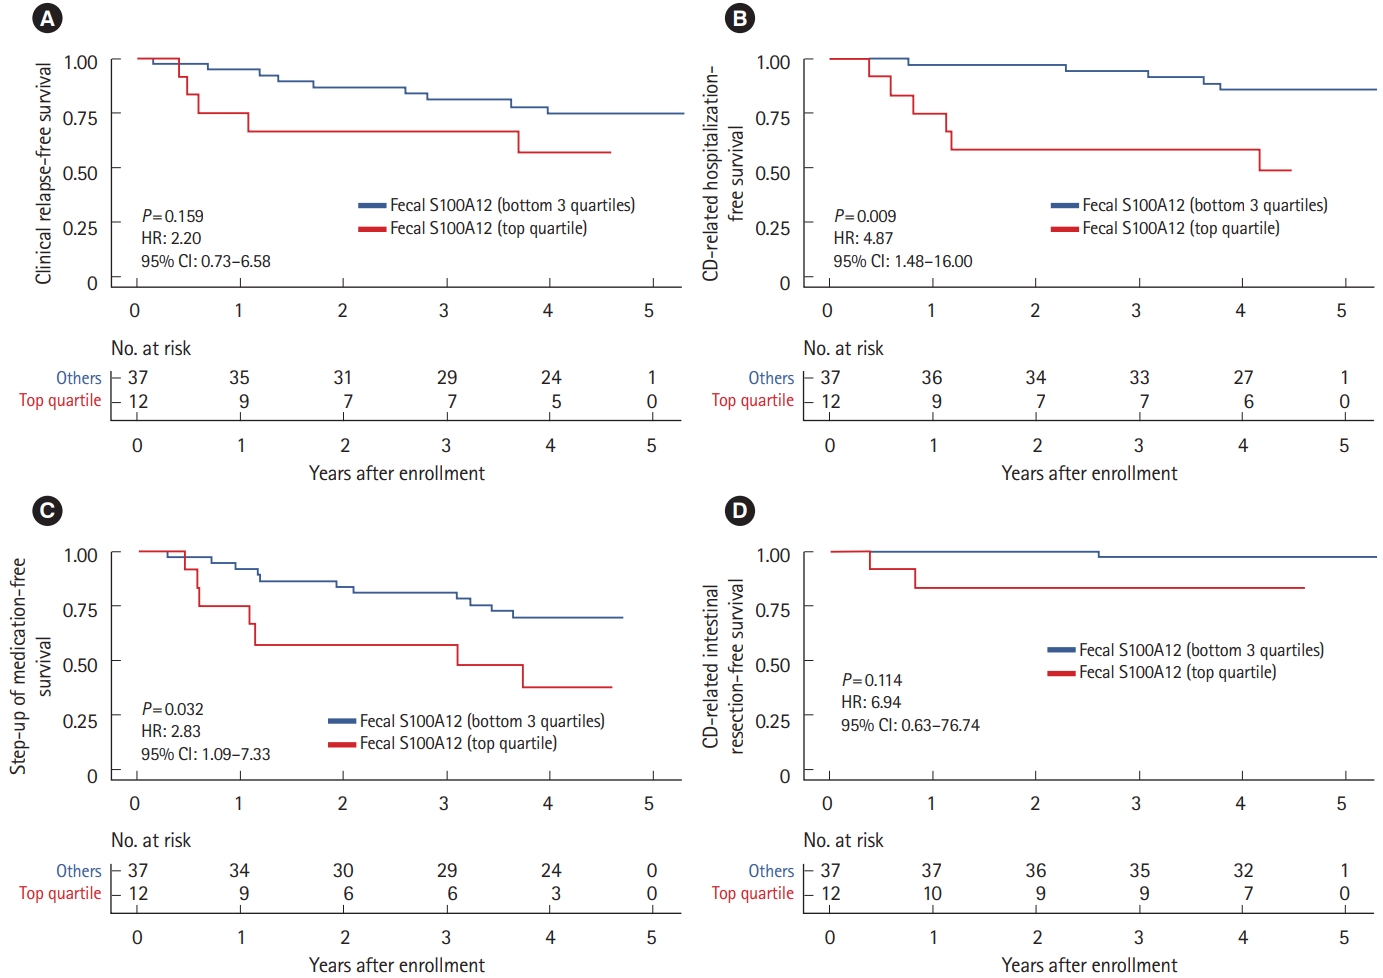
Fourteen patients (28.6%) developed clinical relapse during follow-up, of whom 3 (6.1%), 5 (10.2%), and 8 (16.3%) patients had an event within 6, 12, and 18 months, respectively. Among 11 patients (20.4%) who developed CD-related hospitalization during the study period, 1 (2.0%), 4 (6.1%), and 6 (10.2%) had an event within 6, 12, and 18 months, respectively. Among 18 patients (36.7%) who required a step-up of medical treatment, 2 (4.1%), 6 (12.2%), and 10 (20.4%) had an event at 6, 12, and 18 months, respectively. Finally, only 3 patients (6.1%) had a CD-related intestinal resection, of whom 1 (2.0%) occurred within 6 months and 2 (4.1%) occurred within 12 months.
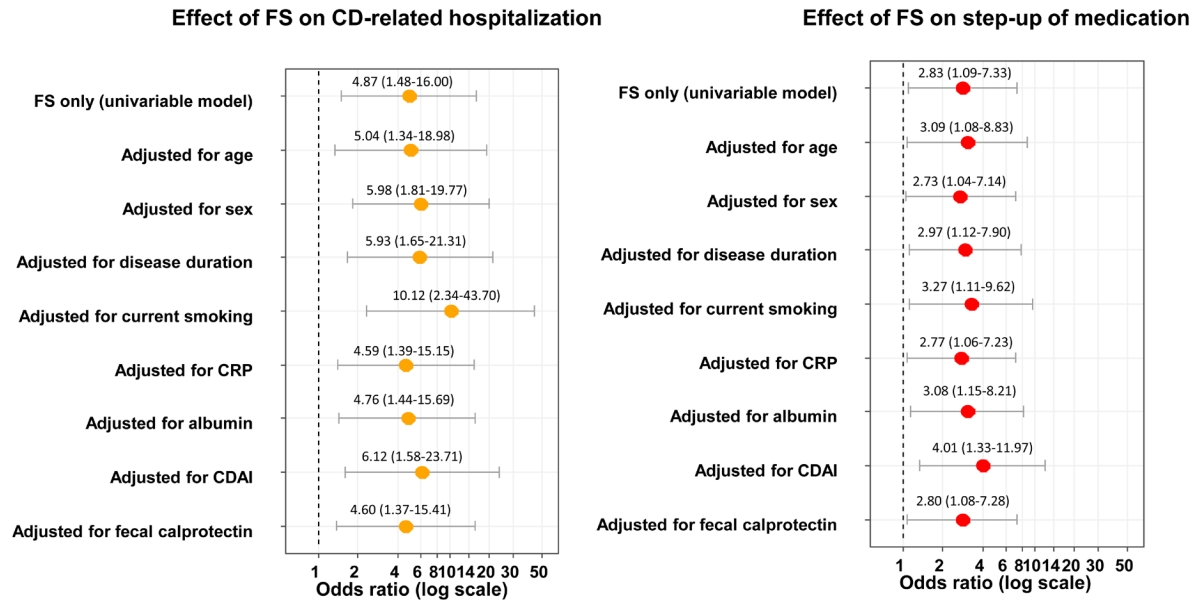
In the time-to-event analyses, increased baseline FS (top quartile) was significantly associated with 4.87-fold increased risk of future CD-related hospitalization (P= 0.009; c-index = 0.687) and 2.83-fold increased risk of future step-up of medical treatment (P= 0.032; c-index = 0.612) (Table 2); the effect size was consistently significant even after adjusting for age, sex, disease duration, current smoking, CRP, serum albumin, CDAI, and increased FC, individually (Fig. 2). Although not statistically significant, increased baseline FC (top quartile) showed a trend of association with time-to-clinical relapse (hazard ratio [HR] 2.58, P= 0.079, c-index = 0.607). No significant association was found between SS and time-to-clinical outcomes. Kaplan-Meier curves based on baseline FS for clinical outcomes are shown in Fig. 3.
4. Optimal Cutoff Values of FS for Its Association with Time-to-Clinical Outcomes
As an exploratory analysis, we derived optimal cutoff values of FS based on the value that maximizes the c-index for each of the time-to-clinical outcomes. Using these cutoff values, FS was significantly associated with CD-related hospitalization, step-up of medication, and CD-related intestinal resection; also, the c-index was increased for these 3 outcomes when using the optimal cutoff values compared to using the top quartiles (Table 3, Fig. 4).
DISCUSSION
In this pilot study, we investigated FS, FC, and SS for their association with time-to-clinical outcomes of CD patients who had been in clinical remission for the past 6 months. In this real-world prospective study, we have included various clinically relevant outcomes including clinical relapse, CD-related hospitalization, step-up of medical treatment and CD-related intestinal resection among CD patients in clinical remission. To date, this is the first study that investigated FS as a noninvasive marker for predicting clinical outcomes in Asian adult patients with CD.
We replicated several findings from previous studies. FS correlated well with FC (r= 0.689), consistent with 2 previous studies [4,16]. Interestingly, Kaiser et al. [14] showed that this correlation between FS and FC was weaker among CD patients (r= 0.324) compared to those of ulcerative colitis (r= 0.534) patients, both of which appeared lower than the correlation coefficient observed in our study. Both FS and FC correlated well with other serum inflammatory makers, consistent with studies mentioned above. With regards to the CDAI score, there was a lack of correlation against both FS (r = 0.045) and FC (r = 0.259), which was consistent with a previously reported weak correlation between FS and CDAI (r= 0.296) from the study by Kaiser et al. [14]. Notably, although all study subjects were in clinical remission (CDAI < 150) at baseline, about two-thirds of the patients had a baseline FC level greater than 250 mg/kg, representing active inflammation [21]. This suggests that the CDAI score is unreliable for capturing evidence of subclinical inflammation in otherwise clinically stable CD patients. Finally, SS did not correlate with fecal markers nor other blood inflammatory markers, consistent with previous studies [16,17].
In our study, FS and FC showed potentials of a marker of poor future outcomes among CD patients in clinical remission. Both FS and FC levels were numerically higher at baseline in patients who developed future clinical relapse, CD-related hospitalization, step-up of medication, or CD-related intestinal resection compared to those who did not. Furthermore, in the time-to-clinical outcome analyses, only increased FS was significantly associated with time-to-CD-related hospitalization and step-up of medication even after adjusting for other inflammatory markers (i.e., CRP and serum albumin), respectively, whereas, increased FC was not associated with any of the time-to-clinical outcomes. In the exploratory analysis using optimal cutoff levels of FS, high FS was also associated with increased CD-related intestinal resection. Indeed, previous studies suggested that FS may be a more specific marker of active inflammation compared to FC [4,14]; S100A12 is known to be predominately derived from neutrophils, whereas calprotectin is derived approximately 60% from neutrophils and can come from other cells i.e., macrophages and epithelial cells [15,22]. Recently, in the CALM study, a biomarker-based (CRP and FC) treatment algorithm showed improved clinical outcomes at 1 year compared to a symptom-based algorithm in patients with CD on adalimumab treatment, whereby FC was a major driver of escalating treatment in the biomarker-based algorithm group [21,23]. Our data suggests that FS may be a better marker for predicting future clinical outcomes given the higher predictability of FS (vs. FC) to predict time-to-hospitalization and time-to-step-up of medical therapy. However, it is still unknown if FS could be a part of an efficient biomarker-based algorithm as in the CALM study; further studies would need to investigate the dynamic change of FS over time and how it relates to clinical outcomes. Also, a head-to-head trial with adequate power comparing the predictive ability of FS and FC is warranted.
We acknowledge several limitations. First, because this study was a pilot study, it was limited in terms of sample size affecting every aspect of the study. Additionally, we had small numbers of clinical outcomes. Due to concerns of model overfitting, we could not include many variables simultaneously to adjust for potential confounding effects. Nevertheless, we have provided the effect size of FS for its association with future clinical outcomes and have performed a post-hoc power calculation for future studies (Supplementary Table 1). Also, we have derived optimal cutoff values of FS for each of the clinical outcomes as an exploratory analysis; however, future studies with a sufficient sample size would need to validate the performance of these optimal cutoff values. Secondly, we did not have serial samples to assess the dynamic change of the markers of interest. Thirdly, endoscopic activity and imaging were not available as clinical outcomes. However, as main clinical outcomes, we included step-up of medication and CD-related intestinal resection, which have been widely used as relatively objective outcome measures for evaluating prognosis of patients with CD. Finally, our study was based on a single-center cohort in Korea, limiting its generalizability. Nevertheless, we point out that this is the first study to assess the performance of FS in CD patients outside North America and Europe. This supports the potential of FS as a noninvasive biomarker in CD patients from other regions or ethnicities.
In conclusion, in this pilot study, FS and not FC was significantly associated with time-to-hospitalization and step-up of medical treatment among patients with CD in clinical remission. FS may be a useful marker of subclinical inflammation that can predict poor future clinical outcomes among CD patients in clinical remission.