


INTRODUCTION
The human gut microbiota is composed of 1013 to 1014 microbes [1], which play a key role in the digestion of food, synthesis of vitamins and amino acids, prevention of pathogen formation, regulation of the immune system, secretion of gastrointestinal hormones, and gut-brain axis [2-6]. According to recent studies, the gut microbiota could contribute to human health and diseases, including obesity, inflammation, cancer development, and behavior [7-11]. As the development of new technology has made it possible to identify novel bacteria that have not been previously known, the interest in the composition and function of the gut microbiota has been increasing [12]. However, despite recent efforts to evaluate the characteristics of the gut microbiota, data on the parameters of the gut microbiota potentially affecting human health and diseases are limited.
Recently, 2 studies have been conducted to assess the association of stool consistency with the gut microbiota. Vandeputte et al. [13] evaluated the association among the stool consistency, intestinal transit time, and composition of the gut microbiota and found that the gut microbiota and stool consistency were closely related. Tigchelaar et al. [14] also observed strong associations of stool consistency with microbiota composition in a large population cohort. Stool frequency is also considered as an important factor that represents bowel function, is easy to measure and record, and has been shown to correlate with stool consistency [15]. Individuals with a high stool frequency often have abdominal discomfort and have to go to the bathroom often, which causes considerable stress; conversely, those with a low stool frequency also sometimes experience abdominal discomfort or distension. According to a survey on 1,897 volunteers, 38% of men and 36% of women have a oncedaily bowel habit; 8.1% of men and 5.2% of women defecate more than twice a day; and 0.6% of men and 3.5% of women have bowel habits less than 3 per week [16]. To date, only 1 study has reported the correlation between stool frequency and gut microbiota composition, which included mainly Europeans older than 50 years [17].
In this study, we enrolled mostly young Koreans and divided them into 3 groups according to their number of defecations per day or week. We hypothesized that the composition and distribution of the gut microbiota among the subjects with a high number of defecation (more than twice a day), subjects with normal defecation, and subjects with a low number of defecation (less than twice a week) are different; in this study, we aimed to investigate the association between gut microbiota and stool frequency.
METHODS
1. Subjects and Stool Collection
A total of 60 healthy subjects aged 22 to 49 years were enrolled in this study conducted at Kosin University Gospel Hospital (Busan, Korea). Patients with a history of cancer or IBD or abdominal surgery and those who had taken antibiotics, laxatives, metoclopramide, tegaserod, erythromycin, or proton-pump inhibitors within 3 months before sampling were excluded. Two investigators (H.J.K. and J.H.K.) explained the aim and contents of the study in detail to the participants, and all participants provided written informed consent. The general information, including age, sex, and medical history of the subjects, was recorded, and the questionnaire for assessing the number of defecations per day or week and Bristol stool scale (BSS) score was filled out by all participants from their 1-week diaries. The subjects were asked to collect their stool using a fecal sample collector kit (Medi4U®, Incheon, Korea) at home and to store it immediately after collection at -20°C in a freezer. Thereafter, the samples were transported to Kosin University Gospel Hospital, enclosed in an insulated foil pack with dry ice, and stored at -80°C in a deep freezer. After collection of all samples, we transported them to Cell Biotech, Co., Ltd. (Gimpo, Korea) and enclosed them in an ice box with dry ice. Fecal sample preparation and data analysis were performed by investigators in Cell Biotech, Co., Ltd. To analyze the difference in gut microbial composition and distribution according to the number of defecation, we divided the subjects into 3 groups according to their usual stool frequency. The usual stool frequency was defined as lasted for 3 months or more: group 1, a small number of defecation ( ≤2 times/wk); group 2, normal defecation (1 time/day or 1 time/2 day); and group 3, a large number of defecation (≥2-3 times/day). This study protocol was approved by the Institutional Review Board of Kosin University Gospel Hospital (KUGH 2017-02-017). Further, the study is registered in clinicaltrials.gov (NCT03153059).
2. Sample Preparation and Data Analysis
Fecal DNA was extracted using commercial “FastDNA Spin Kit for soil” DNA extraction kits (MP Biomedicals, Santa Ana, CA, USA) according to the manufacturer’s instructions. The quality of the extracted genomic DNA was determined using NanoDrop. The DNA concentration of the extracts was measured fluorometrically using the Qubit dsDNA BR assay kit (Thermo Fisher Scientific, Carlsbad, CA, USA); thereafter, the DNAs were stored at -80°C until 16S rDNA library preparation. The V4-V5 region of the bacterial 16S rRNA gene was amplified by following the Illumina 16S Metagenomic Sequencing Library Preparation guide. A forward primer in the v4 region (CCA GCM GCC GCG GTA ATW C) and a reverse primer in the v5 region (CC GTC AAT TYY TTT RAG TTT) were used for PCR amplification in this study. The PCR products were purified using AMPure XP magnetic beads (Beckman Coulter, Brea, CA, USA) on the DynaMag-96 Side Magnet (Thermo Fisher Scientific). The quality of the PCR products was controlled using 2100 Bio-analyzer (Agilent, Santa Clara, CA, USA), and the final DNA concentrations of the purified products were measured using a Qubit fluorometer (Thermo Fisher Scientific). The purified products were mixed in equal molar concentrations to generate a 4-nM library pool. The library pool was sequenced with 250-bp paired-end reads on the MiSeq systems using MiSeq v2 reagent kits (Illumina, San Diego, CA, USA).
3. Statistical Analysis
The CLC Microbial Genomics Module (MGM) as a part of the CLC Genomics Workbench (Qiagen, Venlo, The Netherlands) was used to analyze alpha and beta diversity, and the composition of bacterial community [18]. Raw sequencing reads were imported into the CLC MGM for 16S data analysis, and the operational taxonomic units (OTUs) clustering module and NGS Core Tools were then used to merge the paired-end reads and perform quality control. The OTUs were picked by mapping sequences against the Greengenes database (ver.13_5) and clustered at 99% identity to observe OTU at the species level. Next, the OTUs were aligned using multiple sequence comparison by log-expectation and used to construct a “maximum likelihood phylogenetic tree” followed by alpha and beta diversity analyses.
4. Network Analysis
Co-occurrence network analysis is used as a tool for microbial community analysis. For this analysis, the OTU table was constructed using the microbial community analysis tool (CLC Genomics Workbench version 10.0.1; Qiagen). The correlation of the OTUs between samples was analyzed by Cytoscape (Ver.3.6.0)’s CoNet application [19], using 4 parameters (Pearson correlation, Spearman correlation, Bray Curtis dissimilarity, and Kullback-Leibler dissimilarity). Cytoscape is an open-source bioinformatics software platform for visualizing molecular interaction networks and integrating these networks with gene expression data, proteomics data, gene annotations, and other data [20]. Interactions were assessed using the t-test (P<0.05) at the family level and ANOVA test (P<0.05) at the genus level.
RESULTS
1. Fecal Microbial Richness According to the Number of Defecation
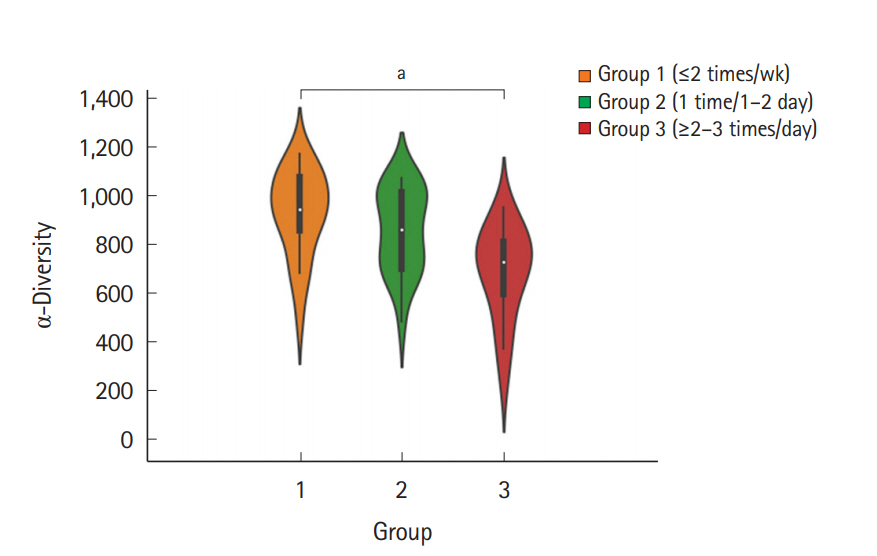
The fecal samples were collected from a total of 60 individuals (31 men and 29 women, aged 34.1±5.88 years), and each group comprised 20 individuals. The baseline characteristics of the subjects are summarized in Table 1. To examine the microbial richness of each fecal sample, we assessed the α-diversity using the vegan and phyloseq R package. The α-diversity was the highest in group 1 and lowest in group 3, and the difference between group 1 and group 3 was significant (Fig. 1). The α-diversity of group 2 was lower than that of group 1 and was higher than that of group 3; however, the differences were not significant. Regarding the BSS score, the α-diversity decreased as the score increased, although the differences between each BSS score were not significant (Supplementary Fig. 1). The α-diversity of the group with a BSS score of 1 or 6 was not assessed because each group included only 1 subject.
2. Fecal Microbial Distribution and Composition Among the Groups According to the Number of Defecation
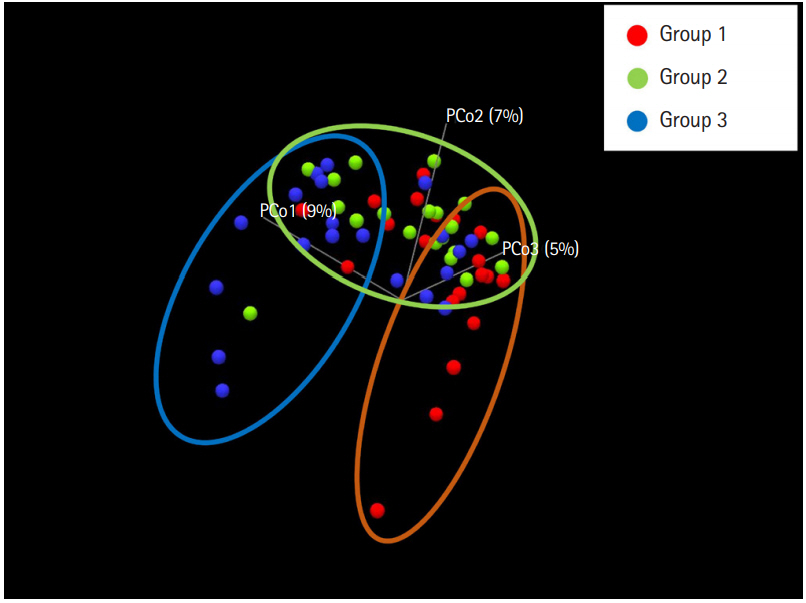
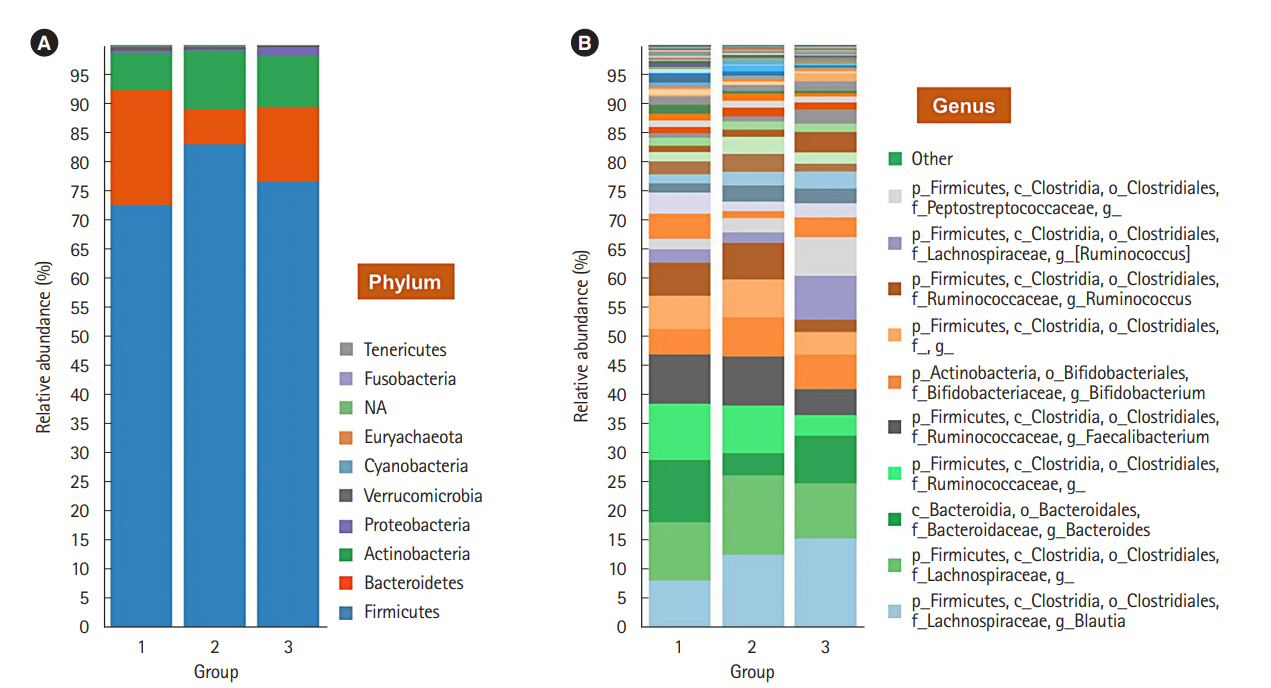
To evaluate the difference in the microbial distribution between each sample in the 3 groups, we assessed the beta diversity using Bray Curtis dissimilarity. Fig. 2 shows the 3-dimensional distribution of the samples, which suggests different biological community compositions. Each sample was fairly separated and showed different distributions according to their group. We also evaluated the microbial composition of each group at the phylum and genus levels. At the phylum level, Bacteroidetes to Firmicutes ratio in group 1 was higher than that in groups 2 and 3; however, the ratio did not decrease with increasing number of defecation (Fig. 3A). Regarding the BSS scores, Bacteroidetes to Firmicutes ratio was higher in the individuals with low BSS scores (2-3) than in those with high BSS scores (4-5) (Supplementary Fig. 2A). At the genus level, the abundance of Bifidobacterium in group 1 was lower than that in group 2 and group 3 (Fig. 3B), and that in the individuals with low BSS scores (2-3) was lower than that in those with high BSS scores (4-5) (Supplementary Fig. 2B). Bacteroidetes to Firmicutes ratio and abundance of Bifidobacterium in the subjects with BSS scores of 1 and 6 were assessed in only 1 subject.
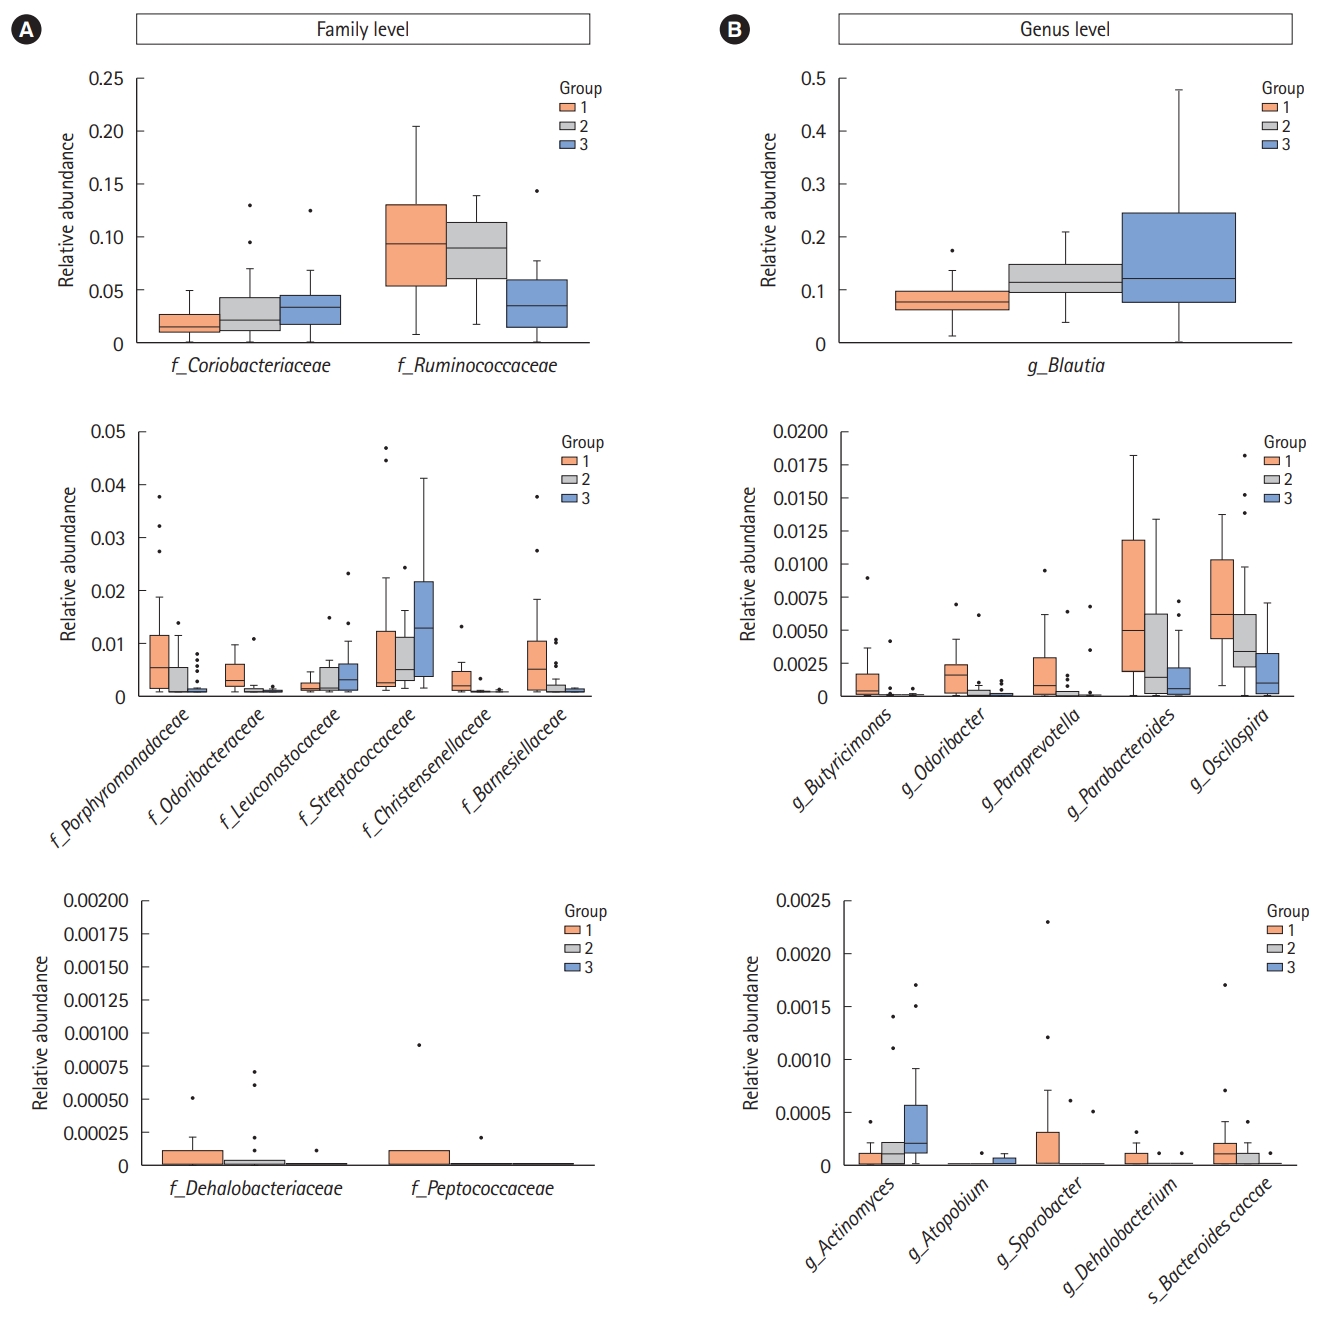
3. Fecal Microbiota Relatively Abundant in Each Group
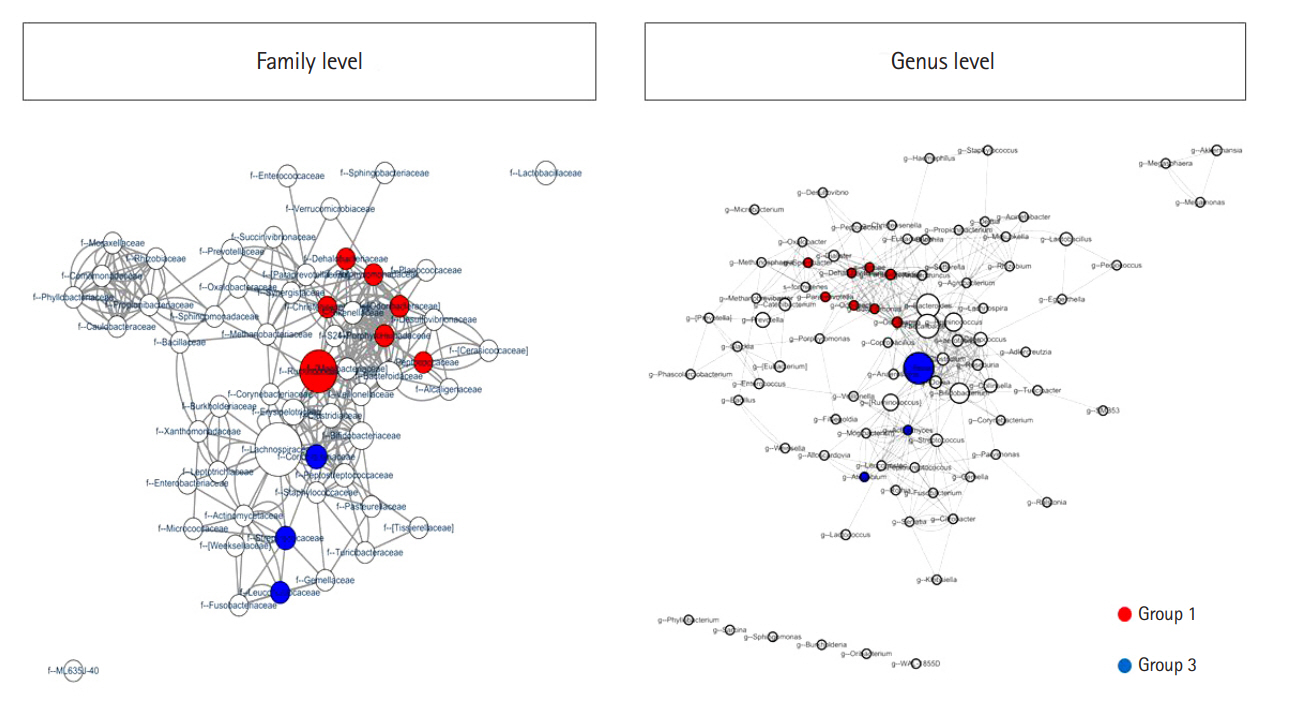
We assessed the correlation between each strain at the family and genus levels using a network analysis (Fig. 4). A co-occurrence network deduced from the relative abundance of each OTU showed different compositions and distributions according to group. Further, we attempted to find specific OTUs that exist in each group and verify the information on the OTUs using the CLC, ChunLab, and NCBI databases. Finally, we identified several OTUs that were abundant in group 1 and group 3 (Table 2 and Fig. 5). At the family level, Porphyromonadaceae, Odoribacteraceae, Christensenellaceae, Dehalobacteriaceae, Peptococcaceae, Ruminococcaceae, and Barnesiellaceae were more abundant in group 1 than in group 3, and these differences were significant. Conversely, Coriobacteriaceae, Leuconostocaceae, and Streptococcaceae were more abundant in group 3 than in group 1, and these differences were also significant. At the genus level, Butyricimonas, Odoribacter, Paraprevotella, Parabacteroides, Oscillospira, Sporobacter, and Dehalobacterium were more frequently identified in group 1 than in group 3; conversely, Actinomyces, Atopobium, and Blautia were more frequently found in group 3 than in group 1. At the species level, only 1 bacterium, Bacteroides caccae, was identified as abundant in group 1. These differences were also significant.
DISCUSSION
In our study, we evaluated the human gut microbial composition and distribution in a population sample of 20 subjects with a small number of defecation (≤2 times/wk), 20 subjects with normal defecation (1 time/day or 1 time/2 day), and 20 subjects with a large number of defecation (≥2-3 times/day). We found 3 groups of individuals that differ by the gut microbial richness, distribution, and composition. These results suggest that the stool frequency might be associated with the richness and community composition of the gut microbiota. To our knowledge, this is the first study to evaluate the association between stool frequency and the gut microbiota in a young Korean population.
Microbiota richness in the human gut is known to be an important parameter in host-microbe symbiosis [21]. Recent studies report that low bacterial richness is correlated with metabolic markers, including adiposity, insulin resistance, and dyslipidemia [22], and microbial richness is strongly associated with stool consistency [13]. Similar to the results of Hadizadeh et al. [17], we found that the microbial richness of group 1 was significantly higher than that of group 3 and tended to decrease with increasing number of defecation; we also identified that the microbial richness decreased as the BSS score increased.
According to studies on the relationship between the composition of the gut microbiota and obesity, Bacteroidetes to Firmicutes ratio in subjects with obesity was lower than that in lean subjects, and even the stools of lean mice could alter the microbial composition of obese mice [23-25]. Vandeputte et al. [13] identified that the Prevotella enterotype is more correlated with loose stool, while the Ruminococcaceae-Bacteroides enterotype dominates the harder stool. In a report on patients with irritable bowel syndrome, the characteristics with a decreased Bacteroidetes to Firmicutes ratio and a reduced level of Bifidobacterium have been shown [26]. In this study, we found that the biological community composition was fairly different according to the number of defecation. Bacteroidetes to Firmicutes ratio was higher in the subjects with a small number of defecation than in those with a large number of defecation, and Bifidobacterium was less abundant at the genus level in the subjects with a small number of defecation. Several studies have reported that Bifidobacterium improves bowel movement frequency in adults with a low stool frequency, which might be helpful to patients with constipation [27-29]. These results suggest that the composition of the gut microbiota is associated with the stool frequency, and the abundance of Bifidobacterium might also be associated with such.
We identified the specific gut microbiota at the family and genus levels existing in group 1 and group 3. As shown in Table 2 and Fig. 5, a total of 14 OTUs were significantly more abundant in the subjects with a small number of defecation than in those with a large number of defecation at the family and genus levels; conversely, 6 OTUs in total were more abundant in the subjects with a large number of defecation than in those with a small number of defecation at the family and genus levels. Of the strains that were more abundant in the subjects with a small number of defecation at the family level, Porphyromonadaceae, Odoribacteraceae, and Barnesiellaceae belong to Bacteroidetes, while Christensenellaceae, Dehalobacteriaceae, Peptococcaceae, and Ruminococcaceae belong to Firmicutes. Of the strains that were more abundant in the subjects with a large number of defecation at the family level, Coriobacteriaceae belongs to Actinobacteria, while vLeuconostocaceae and Streptococcaceae belong to Firmicutes. These results were similar to those at the genus level. Although the function of each bacterium is uncertain, these results suggest the close relationship between the gut microbiota and stool frequency.
In summary, fecal microbial richness, distribution, and composition were different according to the stool frequency, and specific bacteria were identified in the subjects with large and small numbers of defecation, respectively. Although further metagenome-wide association studies of the gut microbiota are needed, the stool frequency might be associated with the richness and community composition of the gut microbiota.